Tips for Profitable Variety Selection: How to Use Data From Different Types of Variety Trials
ID
424-040
Introduction
Selecting an appropriate, high-yielding variety is one of the most important management decisions that producers make. Yield potential is clearly important, but the decision is complicated by such factors as the cropping system, the need for disease resistance, end-use quality goals, year-to-year climatic variation, and the need to select multiple varieties in order to reduce risk by spreading out flowering and maturity dates.
Choosing varieties based on these many variables dictates that a significant amount of information be available about each and every one. This information is available in summaries of variety performance trials. Proper use of variety test performance data is the first step in making these important variety decisions. But in order to make proper use of the data, an understanding of the types of variety trials that are most commonly conducted and the pros and cons of each is needed.
Types of Variety Tests
“This variety yielded better on my farm than this other one.” or “This variety performed well for me last year.”
There are many, many factors that could cause either of these statements to be true: year-to-year weather variation, yield potential differences in and between fields, planting date differences, etc.
Yearly or farm-specific evidence involves a single observa- tion with no direct comparison to other varieties. This information is not without value, however. Most scientifically sound variety trials are designed and sited to avoid major same-soil variability along with pest or previous crop management problems that can and usually will be encountered on an individual’s farm. So, these types of observations about variety performance should be used in conjunction with other variety tests when making a final decision.
Split-Field Comparisons
Split-field comparisons are planned so that two (or sometimes more) varieties are planted side by side in the same or adjacent fields. These tests allow for a “real world” assessment using farm equipment and large areas that should represent the range of soils and crop management scenarios that would normally be seen. The variability in this type of test can also lead to either inaccurate comparisons or difficulty in making comparisons.
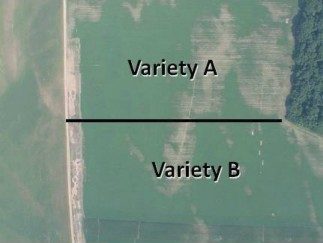
For example, in the fields shown in figure 1A, it is apparent that there are soybean growth differences between the two sides of this field, which are separated by a line. Those differences could be due to soils or they might be due to historical management practices. There’s a farmstead within the field planted to variety A. If, for example, this is an animal operation, guess which field might have received the bulk of the manure.
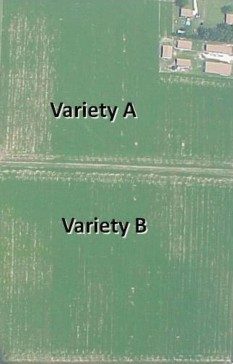
In figure 1B, where varieties A and B are planted side by side in the same field, there is similar variation in crop growth. If the entire area for each variety is harvested and compared on the basis of yield, is the difference due to variety or to field variation? The danger of this type of test is that the comparison may favor field variability rather than variety differences.
It is true that a yield monitor that logs in yield data as the crop is harvested can give some good information about how a variety changes with soil type, but there is still only one side-by-side comparison of varieties.
On-Farm Tests With Multiple Varieties
Unreplicated Strip Plots
An example of unreplicated strip-plot trials is shown in figures 2A-B. Varieties are planted in an adjacent pattern, usually the length of the field. The width of each strip for a variety may be a whole planter/drill-width or a portion of the total. The term “unreplicated” indicates that each variety is planted once at each site. Studies that are “replicated” have each variety planted multiple (generally three or more) times in each field. Unreplicated trials can be a good source of information because they combine the use of farmer equipment and relatively large plot size with the testing of a number of varieties in the same field. The major problem, again, is field variability. It is apparent from figure 2 that there are more problem areas with reduced soybean growth in the part of the field where varieties 1-15 are planted.
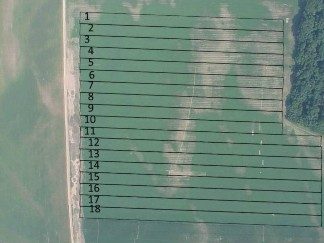
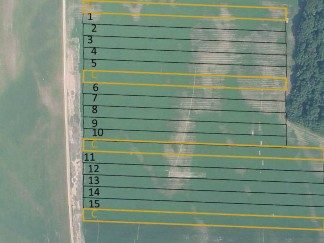
One way to avoid this complication is to use one variety as a repeating check (the “C” in figure 2). With these checks, we can partially measure the variability as we move across the field. This “check” plot design allows for an adjustment of the yields based on the proximity of a variety to the nearest check plot.
Another partial solution to the inequities with an unreplicated strip-plots design is to replicate the same experiment over multiple farms. If all varieties are included at each location, then the locations can serve as replications and the data can be analyzed for statistical differences.
In Virginia, our Extension agents work together annually to establish a number of on-farm variety strip plots using this methodology. Many companies conduct similar trials that include primarily their own varieties, with a few representative varieties from their competitors. There’s nothing wrong with this type of test as long as the competing varieties are those that are known to yield well and to be widely used.
Strip-plot trial data can serve to validate other on-farm tests and replicated small-plot experiments. But there is still the problem of spatial variability that could — as in the example used — misrepresent the varieties, so careful consideration of the results is important. In Virginia on-farm publications, Extension agents often provide useful insight and observations about the trials.
Head-to-Head Comparisons
Head-to-head comparisons are often conducted by splitting the planter or drill with one variety in each half (figure 3). Because the two varieties always occur in the same pattern, the randomization scheme does not necessarily meet scientific requirements. This is not a major issue, especially if at least four or more replications are used. “Randomiza- tion” means that each variety is placed in the field at random and that each has an equal probability of occurring next to another. When we split the planter, we know, for example, that variety 1 will always be to the left of variety 2.
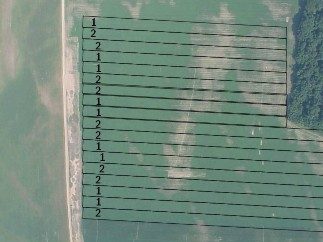
Finally, the use of a yield-monitor-equipped combine in fields such as this one can provide a great deal of beneficial information. There are actually three distinct soil types in the field in figure 3, where yield typically varies by as much as two-fold. Therefore, yield results from this test would tell the producer not only how the two varieties compare on average, but also how they compare in soils that range from low to high productivity.
Official Variety Tests
Agronomists from the state land-grant universities usually conduct official variety tests. The tests usually feature a large number of varieties planted in small plots multiple times (replicated) at each site.
This type of study employs a valid statistical design that likely makes it the only legitimate method for testing a large number of varieties in the same environment. Field sites are selected so that the soil has minimum variability. Experimental protocol ensures that soil fertility is adequate, pests are controlled, and the cultural practices used are optimum for maximizing yield potential. The goal is to minimize any potential nonsoil- and nonweather-related stresses in order to meet the primary objective of comparing yield potential among the varieties.
There are, however, also potential problems with official variety test trials. The first is associated with the small plot size necessary to stay within a uniform soil area. Because the harvest area is small, any error is magnified. For example, harvesting one extra foot from a plot that was supposed to be 17-feet long can result in a 6 percent error unless an adjustment for plot size is made for this particular plot when the data is reviewed and analyzed.
Another potential issue arises when not all varieties are tested at all locations. This can occur because of errors or purposefully when varieties are entered only at some locations. For example, if a certain variety is left out of the highest-yielding location, the average yield of that variety over all of the locations would be lower. Yet, that particular variety could be among the top yielders in the other locations.
A partial solution can be to use relative yields. A “relative yield” is that variety’s yield at one location, divided by the average yield of all varieties at that location. This value is then usually multiplied by 100 to give a percentage. Using this method, a variety that yields the test average will have a relative yield of 100 and a variety that yields 10 percent above the average is given a relative yield value of 110.
Interpreting Data From Variety Trials
There are two important points to understand when using the data from any variety trial:
- The highest-yielding variety from a single location will rarely be the highest-yielding variety the following year at that location.
- The highest-yielding variety selected from multiple location averages will usually be a variety that will yield among the best the following year at any location.
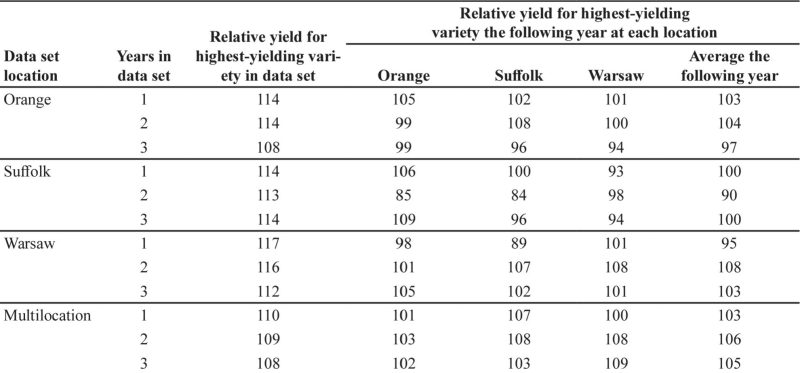
For example, table 1 shows relative yields of soybean varieties over three locations and three years of testing. The first two columns identify the location and the number of years used to choose the highest-yielding variety, respectively. The third column is the relative yield of this highest-yielding variety at a particular location based on one, two, or three years of data. The variety chosen with only one year of data was not always (and not likely) the highest-yielding variety chosen when using two or three years of data. The next columns (4-7) show relative yield of that variety at each of the three testing locations and the average over locations in the following year.
Let’s look at an example. If we chose a variety with only one year of data at the Suffolk location (relative yield = 114), the next year that variety had a relative yield in the Suffolk test of 100, meaning its performance was as good as the average for all entries in the test. Even with two or three years of data for this variety at Suffolk, its performance the following year at Suffolk was not good. However, using the multi-location average data resulted in much greater predictability of performance the following year. In fact, using the multilocation data to choose a variety always gave at least 100 percent of the test average the following year. In fact, when all locations and years were considered, this variety had an average relative yield of 105 percent.
Varieties that have performed well under diverse conditions, as evidenced over locations and years, are likely to perform well again. Depending on a grower’s location, it should be kept in mind that additional performance data about the same variety may be available from other state or private variety testing programs.

Table 1. Example of Virginia soybean variety relative yield performance (as a percentage) over multiple sites and years.
Conclusion
Growers and advisers should utilize multilocation and multiyear performance data to develop a list of the best-suited varieties. Then, once several varieties are selected, performance of those varieties in the closest regional test or from on-farm testing should be considered.
After identifying a group of varieties with high grain-yield potential and stable performance across sites and years, the variety selection process should continue with consideration given to secondary characteristics such as test weight, disease resistance, lodging, height, maturity, and end-use quality.
Virginia Cooperative Extension materials are available for public use, reprint, or citation without further permission, provided the use includes credit to the author and to Virginia Cooperative Extension, Virginia Tech, and Virginia State University.
Virginia Cooperative Extension is a partnership of Virginia Tech, Virginia State University, the U.S. Department of Agriculture, and local governments. Its programs and employment are open to all, regardless of age, color, disability, sex (including pregnancy), gender, gender identity, gender expression, national origin, political affiliation, race, religion, sexual orientation, genetic information, military status, or any other basis protected by law
Publication Date
March 29, 2019