Aerial multispectral imagery for high-throughput mapping of spatial corn yield potentials.
ID
SPES-526NP
Introduction
Timely mapping of grain yield at pre-harvest stages can be critical for the producers to implement appropriate crop management decisions.
Conventionally, yield is evaluated at harvest stages through destructive approach by yield monitoring systems on combine harvesters. Although this data is useful to understand high and low performing areas within the fields and plan for amendments in the future, it does not enable execution of any pre- harvest crop management decisions. Additionally, such yield monitoring systems can be highly expensive and are restricted for providing yield measurements only once for the growing season.
Evaluating yield potentials early in the season not only helps growers to implement crop input management such as pesticides, fertilizers, fungicide, and irrigation (Klompenburg et al., 2020), while estimation at pre-harvest stages would help them to manage harvest, storage and other post- harvest resources, insurance, cash-flow budgeting, and estimate sales and market value among others (Chandel et al., 2021). In such pursuit, mapping yield potentials before harvest has been deemed essential (Klompenburg et al., 2020).
The advent of non-invasive sensing techniques has enabled estimation of crop biomass, nutrient, health, and yield potentials of the crop at pre-harvest stages. Such sensors range from hand-held, ground-based, drone-based, and satellite-based. Hand-held sensors offer restricted sampling and measurements while satellite-based systems are often hindered by cloud covers and restricted resolution.
Drones and spectral imaging for yield mapping
Drones are unoccupied aerial vehicles that have seen significant advancements in the past two decades for agricultural operations, especially crop health mapping and spraying pesticides. Crucial mapping applications include detection and assessments of biotic and abiotic stresses, biomass, and yield potential. Drones equipped with spectral/imaging cameras can provide detailed (up to mm of resolution) and high-throughput data, which increases the potential for prompt crop management. Aerial imaging enables understanding and management of spatial variations within the fields, which is not quite often possible with manual scouting or intensive plant/soil analysis. More importantly, drone imaging can be conducted quickly when crop assessments are deemed critical. Imaging for agricultural crops has evolved over time and typically includes visible or RGB, Hyperspectral, Multispectral, Fluorescence, and Thermal range among others (Chandel, 2023).
Vegetation indices are the most widely used features of spectral imagery for crop analysis. Some of the popular indices include but are not limited to Normalized Difference Vegetation Index (NDVI), Green-NDVI, Normalized Difference Red-Edge Index (NDRE, Ranjan et al., 2019; Chandel et al., 2021). Typically, the higher the magnitudes of vegetation indices, the higher the biomass content and yields.
This article summarizes a recent exploration on drone-based multispectral imagery to estimate grain yield potential of corn. Similar updates on variousother crops of interest will also be published as progress is made on this subject.
Corn trials and data collection
Four corn fungicide trials were conducted at the Tidewater Agricultural Research and Extension center in Suffolk, VA (Fig. 1). Plots were 4-rows, 30-ft long with fungicide treatments applied to the two center rows of each plot. Plots were arranged in a randomized complete block design with four replications per treatment for total of 116 individual plots. A drone was flown in mission-mode over the trial plots at vegetative stage-R5 (August 25, 2022) at an altitude of 25 m above ground. This mission captured high resolution (@ 1 cm/pixel) multispectral image snapshots (in Blue, Green, Red, Red-Edge, and Near-infrared wavelength ranges, Drone: DJI Phantom 4 Multispectral). The imaging was conducted near solar (± 2h) noon period for high quality crop feature retrieval. The drone also has a skyward facing light sensor to measure solar radiation intensity while imaging. This measurement is important as it is used to correct any inconsistencies in spectral signatures occurring due to sunlight fluctuations. The plots were harvested on September 21, 2022, using a plot combine and yield was recorded using a yield monitor on-board.
Spectral imagery processing
Multispectral imagery snapshots captured by the drone were initially stitched in a mapping software platform (Pix4D mapper) to generate orthomosaic maps for each corresponding wavelength sensor (i.e., Blue, Green, Red, Red-Edge, and Near- Infrared). These maps were then exported into Geographical Information System software (QGIS)
to extract a total of 24 vegetation index feature maps (Chandel et al., 2021). From these maps, feature values were extracted for each trial plot (Total 116) using a combination of shapefiles and zonal statistics toolbars in the software. These values were then contrasted with actual yield recorded at harvest using statistical correlation (r) and regression coefficients (R2). These statistical analyses were conducted to observe the significance of yield potential mapping using drone-based spectral imaging.
Results
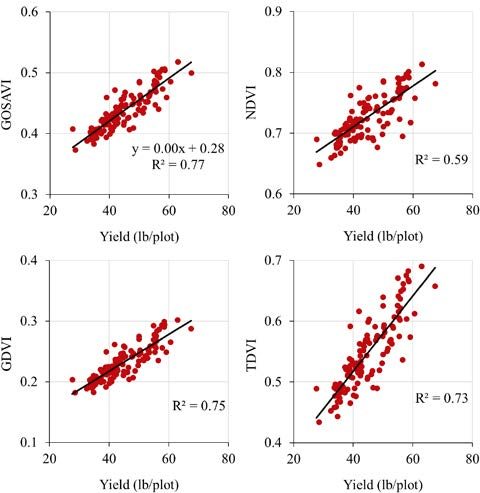
Among the derived spectral features, the regression plots revealed that GOSAVI (Green Optimized Soil Adjusted Vegetation Index, R2 = 0.77) had the highest accuracy for yield estimation, followed by GDVI (Generalized Difference Vegetation Index, R2 = 0.75), and TDVI (Transformed Difference Vegetation Index, R2 = 0.73). NDVI showed relatively lower accuracy.
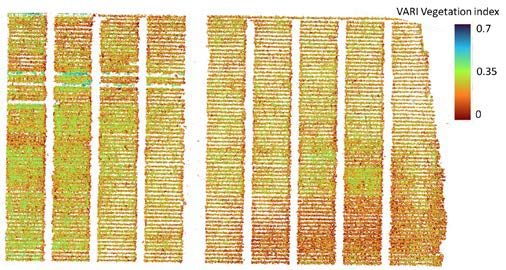
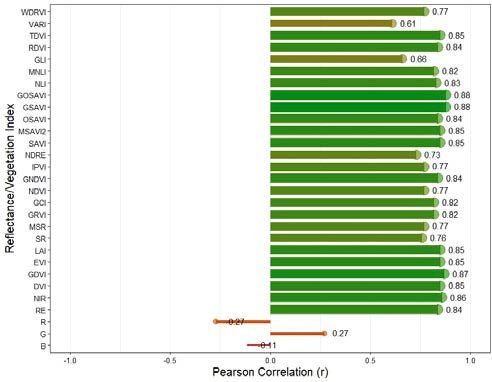
Similar to regression analysis, correlation analysis also revealed the highest value for GOSAVI (r = 0.88) i.e., highest accuracy for corn grain yield estimation. Among the evaluated vegetation indices, VARI (Visible Atmospherically Resistant Index) had the lowest accuracy (R2 = 0.37, r = 0.61). Figure 3 shows the correlation coefficients (representing accuracy) for estimating corn grain yield potentials using raw reflectance and vegetation indices.
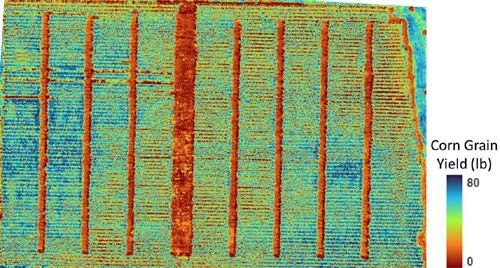
GOSAVI showed the highest accuracy because it is highly sensitive to biomass content. For this reason, it has also been reported to be a more reliable estimator of corn nitrogen status and requirements for precision fertilizer applications compared to NDVI. Figure 4 shows pixelated yield projections derived using best performing vegetation index i.e., GOSAVI.
Conclusions and future scope
Drone-based spectral imaging is a nondestructive approach for estimating corn grain yield efficiently prior to harvest. Such spatial estimations if done early in the season could help growers to identify lower performing areas of the field. This will guide them to adopt prompt, precise and cost-effective crop management operations (e.g., irrigation, fertilizer or fungicide applications) in the same season or before/during next cropping season. Pre-harvest yield estimates would help in better planning and allocation of harvest, storage, and sales resources for higher profitability and crop value.
Using the findings reported in this study, our group is working to identify the earliest time stamp in the season when accurate spatial yield projections could be made so that further precision in disease management, fertilizer applications, or irrigation could be established.
References
Chandel, A.K., L.R. Khot, and L.X. Yu. 2021. “Alfalfa (Medicago sativa L.) crop vigor and yield characterization using high-resolution aerial multispectral and thermal infrared imaging technique.” Computers and Electronics in Agriculture 182, p.105999.
Van Klompenburg, T., A. Kassahun, and C. Catal. 2020. “Crop yield prediction using machine learning: A systematic literature review.” Computers and Electronics in Agriculture 177, p.105709.
Ranjan, R., A.K. Chandel, L.R. Khot, H.Y. Bahlol, J. Zhou, R.A. Boydston, and P.N. Miklas. 2019. “Irrigated pinto bean crop stress and yield assessment using ground based low altitude remote sensing technology.” Information Processing in Agriculture 6(4): 502-514.
Sripada, R. 2006. "Aerial Color Infrared Photography for Determining Early In-season Nitrogen Requirements in Corn." Agronomy Journal 98: 968-977.
Virginia Cooperative Extension materials are available for public use, reprint, or citation without further permission, provided the use includes credit to the author and to Virginia Cooperative Extension, Virginia Tech, and Virginia State University.
Virginia Cooperative Extension is a partnership of Virginia Tech, Virginia State University, the U.S. Department of Agriculture, and local governments. Its programs and employment are open to all, regardless of age, color, disability, sex (including pregnancy), gender, gender identity, gender expression, national origin, political affiliation, race, religion, sexual orientation, genetic information, military status, or any other basis protected by law
Publication Date
October 24, 2023