Aerial imagery to improve disease diagnosis and management in field crops
ID
SPES-515NP
Introduction
Timely crop disease management has been a continual challenge for producers. Diseases impact overall plant processes that ultimately cause yield losses of up to 90% if left unmanaged. With growing concern over cost-effective control, uncompromised crop yield and quality, and environmental sustainability; precision management has emerged as a critical need. Specifically, identifying the amount, temporal frequency, and spatial variability of plant protection input applications offers a promising new avenue of effective and affordable disease management. Conventional disease assessment techniques are inadequate, spatially inaccurate, and expensive (time and cost wise) to implement. The advent of drones and spectral imaging cameras can serve as an effective alternative. This article summarizes the concept and operating pipeline of drones and spectral imaging sensors towards high- throughput disease diagnosis and precision management. As part of this series of Extension publications, we will be publishing updates on our on-going research in this area on various crops as progress is made on this subject.
Conventional Disease Assessment Techniques
Historically, manual/visual field scouting has been the standard method for identifying disease infestations. This technique may work to some extent for airborne or foliar diseases but is lacking in accuracy and precision when considering soilborne diseases (until the visible symptoms become very apparent). Normally, biological changes occurring in crop canopy or fruit/grains are not immediately visible to naked eye. Therefore, for both disease
types, appearance of symptoms is often an indication that it is already too late to avoid yield losses or a missed opportunity for deploying rescue treatments. Visible disease symptoms are often confused with other types of stressors such as soil pH, water stress, soil compaction, nutrient deficiencies, or other biotic or abiotic stressors (Coyne et al., 2007). Moreover, diseases can be confused with one another unless examined by a trained expert or pathologist. In addition, visual scouting can be very subjective, prone to prejudice, can be masked depending on environmental conditions and time of day, leading to costly errors (Barbedo, 2016).
Destructive crop sampling is the second most preferred method for accurate disease detection and identification. Crop or soil samples are collected at random from the field based on historic assessments and then analyzed in the lab through specific tests. For example, to identify nematode infestation, soil core samples are collected from the field, cleaned using eludriator, and then specimens are prepared using sugar solutions. These specimens are visually observed under a microscope to identify and count nematode types. Destructive and/or intensive sampling and analysis can be extremely tedious and time-consuming. For this reason, it may not be possible to collect and analyze the minimum number of samples needed to represent spatial occurrence of crop diseases within a field. Furthermore, shortage of trained nematologists with taxonomic experience further intensifies the manual assessment and delays obtaining results during peak seasons. Such delay can result in poor management decisions, future crop failures, and economic losses. Clearly, this triggers the need for high-throughput techniques for crop disease diagnosis.
Emergence of Drones
Drones are unmanned aerial vehicles that have seen significant advancements in the past two decades for agricultural operations, especially mapping and spraying. Crucial mapping applications include detection and assessments of biotic and abiotic stresses. Drones equipped with spectral/imaging cameras can provide detailed (up to mm of resolution) and high-throughput data, and thereby the potential for prompt crop protection. Aerial imaging enables understanding and management of spatial variations within the fields, which is not quite often possible with manual scouting or intensive plant/soil analysis. Most importantly, drone imaging campaigns can be conducted on-demand and quickly when crop health assessments are deemed critical.
Spectral imaging for crop disease diagnosis
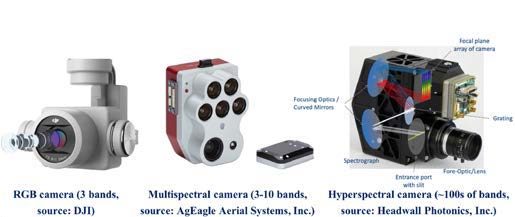
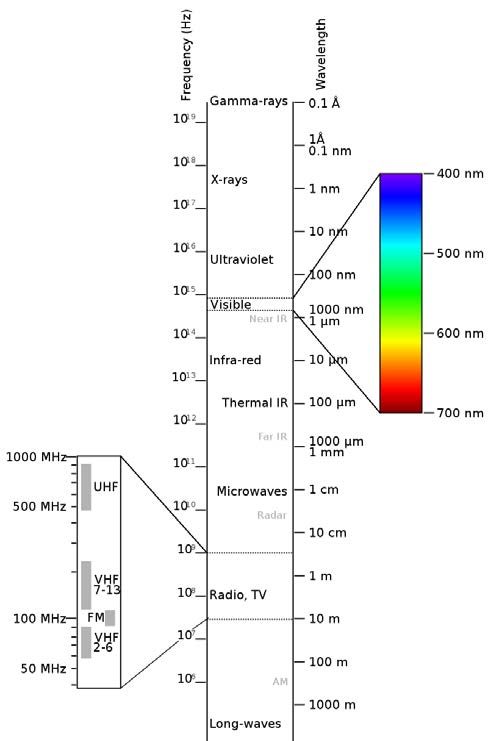
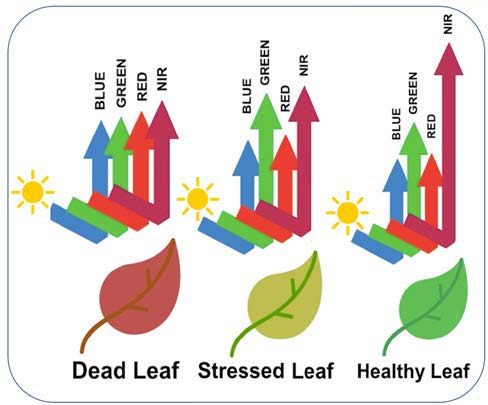
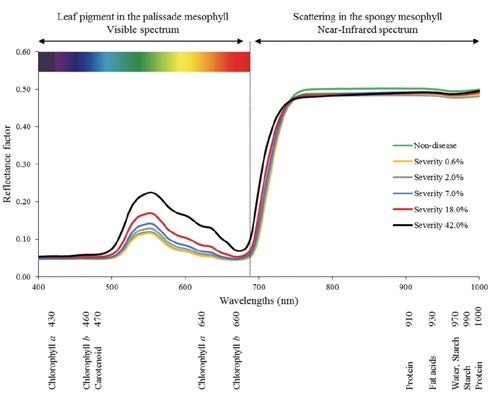
Imaging for agricultural crops has evolved over time and typically includes visible or RGB, Hyperspectral, Multispectral, Fluorescence, and Thermal-range imaging among others (Figures 1 and 2). RGB imaging is similar to what the naked eyes can observe while fluorescence, hyperspectral, multispectral, and thermal imagers capture signatures or profiles of plants in terms of light, reflectance, and emissivity beyond visible-range imaging. Hyperspectral cameras comprise of 100s and 1000s of wavelengths (or sensors) while multispectral cameras comprise of 3 to 10 wavelengths within RGB and Near-infrared ranges shown in figures 1 and 2. These cameras are quite widely used for plant disease diagnosis as those can capture signatures pertaining to biological changes in crops (Figure 3), even prior to appearance of visible symptoms. Reflectance, which is the ratio of light/energy reflected from the crop surface to the light/energy incident on the crop surface is captured by the spectral cameras in these wavelengths. Figure 4 illustrates hyperspectral reflectance signatures for soybeans infected with varying severity of Asian rust. It can be observed that within 400-700 nm (i.e., Visible range) the reflectance is distinctly higher for higher levels of disease severity. This trend reverses within the Near-infrared spectrum where reflectance for a healthier crop is higher. Such signatures can potentially be utilized to identify crop types as well as the levels of disease incidence and/or severity.
Spectral vegetation indices for mapping crop diseases
Vegetation indices are the most widely used features of spectral imagery to detect crop problems. These are derived using computer-driven mathematical normalization (calculation) of reflectance signatures measured in different wavelengths of the spectral sensors/cameras. Some of the popular indices include but are not limited to Normalized Difference Vegetation Index (NDVI), Green-NDVI, Normalized Difference Red-Edge Index (Ranjan et al., 2019; Chandel et al., 2021a). Typically, the higher the magnitudes of such vegetation indices, the healthier that the plants are (and vice versa for stressed plants). Different vegetation indices have demonstrated potentials for detecting different crop problem combinations (Singh et al., 2020; Chandel et al., 2021b) as also summarized in table 1.
Crop |
Problem |
Vegetation Indices Used |
|---|---|---|
Soybean |
Cyst nematodes |
GOSAVIa, NDREb, GNDVIc, GCId, GRVIe |
Peanuts |
Sclerotinia Blight |
GLIf, NLIg, OSAVIh, IPVIi, NDVIj |
Corn |
Leaf spot |
GOSAVIa, GNDVIc, GCId, GRVIe |
a: Green Optimized Soil-Adjusted Vegetation Index
b: Normalized Difference Red-Edge Index
c: Green Normalized Difference Vegetation Index
d: Green Chlorophyll Index
e: Green-Red Vegetation Index
f: Green Leaf Index;
g: Non-Linear Index hOptimized Soil-Adjusted Vegetation Index iInfrared Percentage Vegetation Index eNormalized Difference Vegetation Index
Diagnosis to management: the precision way forward
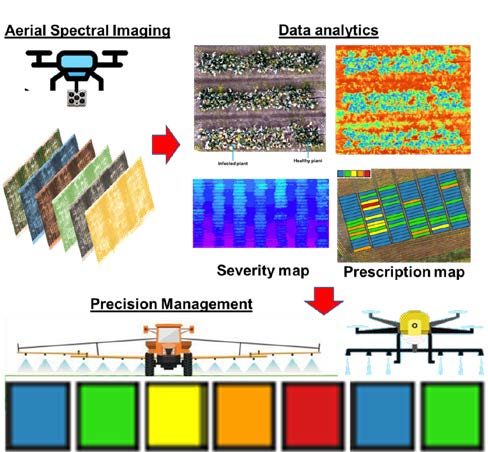
Leveraging high-throughput spectral imagery from drones and deploying vegetation indices or artificial intelligence algorithms can help derive early projections of disease occurrences. These derivations can be converted to zone-based prescription maps using GIS tools. Once obtained, these GIS-based “shapefiles” are feedable to modern-day tractor retrofits and drone-based sprayers to calibrate variable application rates of plant protection products. Research has been on-going to make this process seamless (Figure 5). Ultimately, this will enable producers to apply control measures only when needed, where needed, and in the amounts needed for uncompromised yield and production sustainability.
References
Barbedo, J.G.A. 2016. “A review on the main challenges in automatic plant disease identification based on visible range images.” Biosystems Engineering 144: 52-60
Chandel, A.K., L.R. Khot, and L.X. Yu. 2021a. “Alfalfa (Medicago sativa L.) crop vigor and yield characterization using high-resolution aerial multispectral and thermal infrared imaging technique.” Computers and Electronics in Agriculture 182, p.105999
Chandel, A.K., L.R. Khot, and B. Sallato. 2021b. “Apple powdery mildew infestation detection and mapping using high-resolution visible and multispectral aerial imaging technique.” Scientia Horticulturae 287, p.110228
Coyne, D., L. Nicol, and B. Claudius-Cole. 2007. “Nematologia pratica: Um guia de campo e de laboratorio. West Africa: International Institute of Tropical Agriculture (IITA)”
Furlanetto, R.H., M.R. Nanni, M.S. Mizuno, L.G.T. Crusiol, and C.R. da Silva. 2021. “Identification and classification of Asian soybean rust using leaf-based hyperspectral reflectance.” International Journal of Remote Sensing 42(11): 4177-4198
Ranjan, R., A.K. Chandel, L.R. Khot, H.Y. Bahlol,
J. Zhou, R.A. Boydston, and P.N. Miklas. 2019. “Irrigated pinto bean crop stress and yield assessment using ground based low altitude remote sensing technology.” Information Processing in Agriculture 6(4): 502-514
Singh, V., N. Sharma, and S. Singh. 2020. “A review of imaging techniques for plant disease detection.” Artificial Intelligence in Agriculture 4: 229-242
Virginia Cooperative Extension materials are available for public use, reprint, or citation without further permission, provided the use includes credit to the author and to Virginia Cooperative Extension, Virginia Tech, and Virginia State University.
Virginia Cooperative Extension is a partnership of Virginia Tech, Virginia State University, the U.S. Department of Agriculture, and local governments. Its programs and employment are open to all, regardless of age, color, disability, sex (including pregnancy), gender, gender identity, gender expression, national origin, political affiliation, race, religion, sexual orientation, genetic information, military status, or any other basis protected by law
Publication Date
August 11, 2023