2023 Potato Variety Evaluation for the Eastern Shore of Virginia
ID
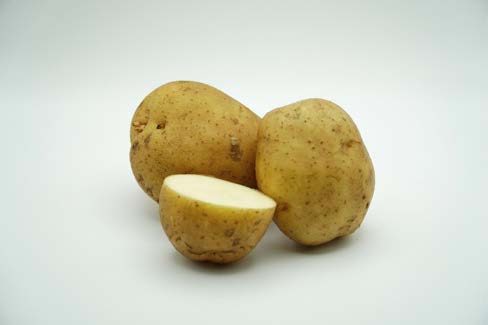
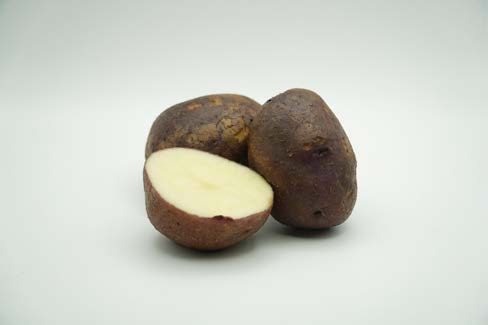
SPES-521NP
Fundamentals of cultivar selection
Potatoes (Solanum tuberosum) have long been a staple crop in Eastern Virginia, contributing significantly to the region's agricultural economy and providing a valuable food source for both local and regional markets. Achieving high potato yields with excellent quality is a top priority for farmers and researchers alike. This critical objective is contingent on a combination of factors, with the selection of the right potato cultivar at the forefront. The choice of potato cultivar is a pivotal decision that can significantly influence the success of potato farming in Eastern Virginia. Different potato cultivars exhibit varying levels of adaptability to the region's unique climate, soil conditions, and disease pressures. These variations highlight the importance of selecting cultivars that are well-suited to the specific growing conditions of Virginia.
In accordance with the climate categorization devised by Wladimir Koppen and further enhanced by Glen Trewartha, Virginia experiences a "Mild mid-latitude" climate and falls within the subcategory of "Humid subtropical." It is designated as "Cfa" on the Koppen classification system due to its temperate nature, absence of a dry season, and hot summer conditions (Climate Data, 2023).
Cultivars must be carefully chosen to thrive in this environment, with consideration given to factors such as temperature fluctuations, precipitation patterns, and frost susceptibility. For example, cultivars with resistance to late blight, a common potato disease in the region, are highly desirable. Potatoes in this region are vulnerable to a range of pests and diseases, including beetles, nematodes, and fungal pathogens. Selecting cultivars with inherent resistance or tolerance to these threats can reduce the need for chemical interventions and promote sustainable farming practices.
Additionally, the soil composition in Eastern Virginia varies from sandy to loamy, and a correct assessment of a cultivar should consider soil drainage, fertility, and pH levels. Certain potato cultivars are better adapted to specific soil types, ensuring optimal nutrient uptake and root development.
Ultimately, the primary goal of potato cultivation is to achieve high yields, quality, and extended shelf life. The selection process should prioritize cultivars for their yield potential and consider their ability to produce quality tubers suitable for both fresh market and processing.
Evaluation Process
Before a new potato cultivar is released to farmers, it must undergo rigorous field evaluation. This process involves assessing the performance of the new cultivars by planting them in experimental plots under local conditions. During this process, several key aspects are examined:
Yield Potential
Field trials measure the yield of the new cultivars compared to established varieties under local production practices. This data is crucial in determining whether a cultivar is adequate for commercial production and includes yield per acre, average tuber side, and tuber quality parameters.
Researchers also consider plant vegetative parameters in the evaluation process, as these data points are fundamental to making sense of the yield results and improving the specific production system for each cultivar. Data parameters often include germination percentage, Leaf Greenness, and Normalized Difference Vegetation Index.
Normalized Difference Vegetation Index (NDVI)
The NDVI provides valuable information about the health and vigor of vegetation, which is essential for making informed decisions in agricultural practices (GISGeography. 2023). Healthy vegetation reflects more near-infrared (NIR) and green light compared to other wavelengths. This is why our eyes see vegetation as green. However, if you could see near- infrared, then you would perceive a strong reflective red color as well. The NDVI compares the difference between the reflected NIR and the reflected red light. If a plant is healthy, it will reflect more NIR and absorb more red. The NDVI is designed to be highly precise to these changes in light, allowing us to detect differences between plants that would not be possible to detect just by looking at them with the naked eye. Additionally, it allows us to be consistent with our measures using a normalized scale, in this case, light reflection. NDVI value ranges are often interpreted as follows:
Low or Negative NDVI (-1 to 0): NDVI values close to zero or in the negative range typically represent non-vegetated or barren surfaces such as water bodies, urban areas, or bare soil.
Low to Moderate NDVI (0.1 to 0.2): These values may correspond to scarce or stressed vegetation, recently planted crops or areas with limited vegetation cover.
Moderate NDVI (0.21 to 0.5): This range often represents areas with some healthy vegetation cover but may include a mix of vegetation and non- vegetated surfaces.
High NDVI (0.51 to 0.8+): NDVI values in this range are typically associated with healthy and dense vegetation. The higher the NDVI value within this range, the more robust and vigorous the vegetation. It's important to note that the specific threshold values for what is considered "adequate" or "healthy" NDVI can vary depending on the vegetation type, region, and the goals of the analysis (GISGeography. 2023).
Leaf Greenness (SPAD)
SPAD (Soil-Plant Analysis Development) is a non- destructive method used to measure the greenness or chlorophyll content in plant leaves. It is a widely used tool in agriculture, horticulture, and plant science to assess the health and nutritional status of plants. The SPAD meter, also known as a chlorophyll meter, is a handheld device that provides a quantitative measurement of chlorophyll concentration in leaves (Xiong et al., 2015).
General guidelines for SPAD values in potato plants can vary in accordance with the crop stage.
Early Growth Stage (Vegetative Stage): During the early vegetative growth stage, SPAD values for healthy potato plants typically fall in the range of 30 to 60. This range may vary slightly depending on factors like soil fertility and the specific potato variety being grown.
Mid-Growth Stage (Tuber Initiation and Development): As the potato plants transition to the stage of tuber initiation and development, SPAD values may continue to increase. SPAD values in the range of 40 to 70 are often considered adequate for this stage.
Late Growth Stage (Maturity): As potato plants approach maturity and the tubers develop, SPAD values can vary widely. SPAD values between 40 and 80 or higher are common during the late growth stage, depending on factors like variety and local conditions.
Variety-Specific Differences: Different potato varieties may have slightly different SPAD value ranges that are considered adequate. Some varieties naturally have higher chlorophyll content and may have higher SPAD values throughout their growth cycle.
Specific Gravity
Specific gravity in potatoes is a measure of the density or weight of potato tubers relative to the density of water. It is an important quality parameter used to assess the starch content and cooking characteristics of potatoes, especially for processing purposes. Specific gravity is typically expressed as a dimensionless number and is sometimes referred to as potato gravity or potato starch content (Wilson and Lindsay. 1969).
Specific gravity in potatoes is determined by comparing the weight of a potato sample to the weight of an equal volume of water. This is usually done by weighing the potato sample both in the air and while submerged in water. The specific gravity is calculated using the formula:
Specific Gravity (SG) = Weight in Air / (Weight in Air - Weight in Water)
The ideal specific gravity range can vary depending on the specific requirements of the processing industry, but it often falls between 1.070 and 1.080 for optimal processing quality. Potatoes falling within this range are considered suitable for processing into high-quality products (Wilson and Lindsay. 1969).
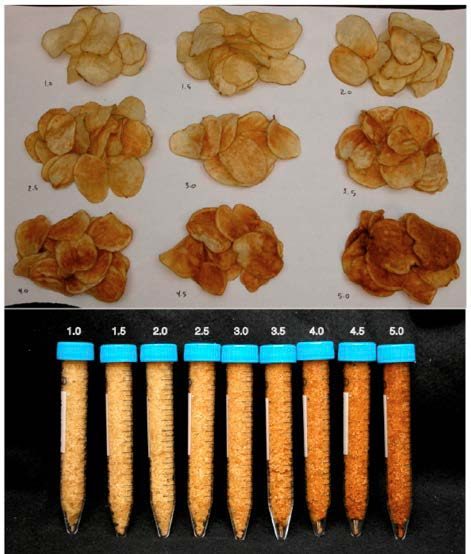
Snack Food Association (SFA) chip color measurement standard
The SFA (Snack Food Association) chip color measurement standard plays a significant role in assessing the quality of chips following the frying process. On this scale, a lighter color (assigned a score of 1.0) is highly sought after, while a darker color (scored at 5.0) is deemed unacceptable (Figure 1, Wayumba, 2019). A value of 2.5 or higher is considered not acceptable for commercial processing.
Brown Center (BC)
Brown center in potatoes is a quality issue that affects the internal appearance of the potato tuber. It is characterized by the presence of a brown or dark- colored region in the center of the potato, which contrasts with the normally white or cream-colored flesh. This browning typically occurs due to enzymatic and chemical reactions within the potato tuber and is associated with specific conditions and practices during potato growth and storage (Zotarelli et al., 2012).
Hollow Heart (HH)
Hollow heart is a common physiological disorder that can occur in potatoes. It is characterized by the presence of hollow cavities or air pockets in the center of the potato tuber, typically running lengthwise. These cavities can vary in size and shape and may be accompanied by brown or discolored tissue surrounding the hollow area (Department of Primary Industries and Regional Development. 2016). Hollow heart is not caused by disease or pests but is instead a result of irregular growth and development within the potato tuber. Certain potato varieties are more prone to hollow hearts than others, as some varieties have a genetic predisposition to this disorder.
Vascular Ring Discoloration (VRD)
Vascular ring discoloration in potatoes is a physiological disorder that affects the internal quality of potato tubers. It is characterized by the presence of brown or dark-colored rings or streaks that develop within the vascular tissue of the potato tuber. These rings or streaks are usually arranged in concentric circles, resembling the growth rings of a tree. VRD typically occurs in the tuber's vascular system, which includes the phloem and xylem tissues responsible for transporting nutrients and water throughout the plant (University of Nebraska – Lincoln, 2023).
2023 Cultivar Evaluation
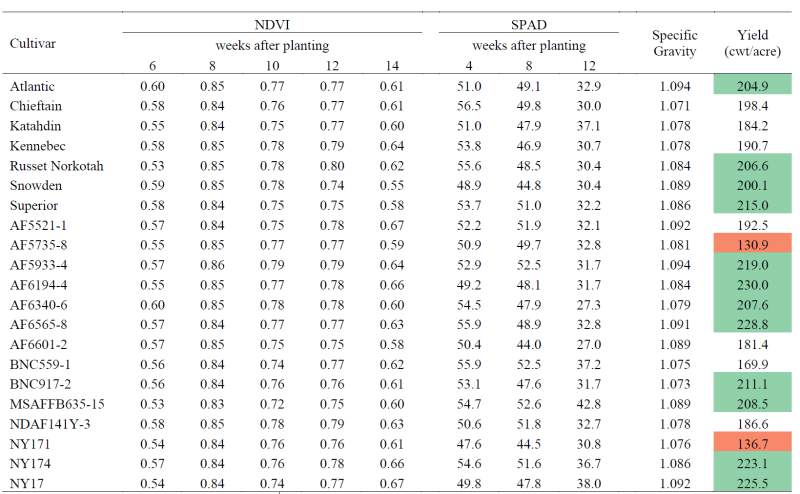
A total of 21 potato clones were evaluated at the Eastern Shore Agricultural Research and Extension Center in 2023. Experimental plots were established in a Completely Randomized Block Design with 4 replications. 40 plants per plot, in 30-ft long plots. Plants were distributed in a single row with 9 inches of in-row spacing. Potatoes were planted on March 17 and fertilized with 60 lb/A of 10-10-10. During the planting process, potato seeds were treated with Quadris + Ridomil gold (6 oz/A), and Platinum 75 SG (2.67 oz/A). Plants received a total of 180 lb/A of nitrogen, 43.7 lb/A of P2O5, and 166 lb/A of K2O. Additionally, the crop received an average of 2 inches of water per week, starting the third week after planting and finishing a week before desiccation. Plants were cultivated during the first week of April and treated with Boundry 6.5EC, for weed control. A second herbicide application was done on April 18 (TriCor™ DF + Dual II Magnum). On May 23, plants received a foliar fungicide application of Ridomil Gold MZ, (2.5 lb/A), and on July 11, plants were desiccated using a foliar application of Reglone (2 pts/A). Potatoes were harvested on August 02. Figure 2 shows the average, minimum, and maximum temperature and daily rainfall at the experimental site during the evaluation.

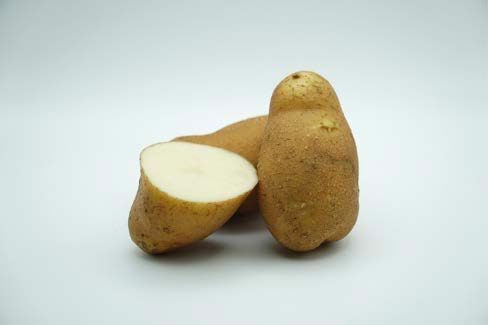
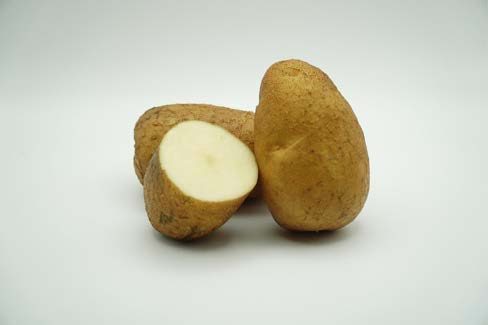
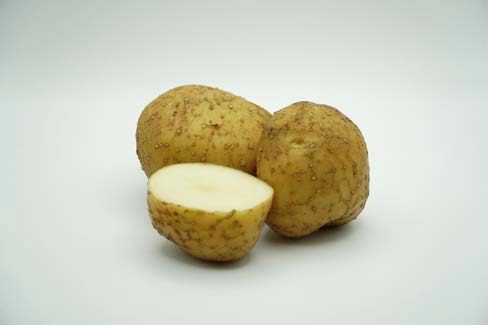
Atlantic
The germination percentage of cultivar ‘Atlantic’ was 84.3% at 30 days, and 93.1% at 45 days after planting. The average Leaf Greenness at 4, 8, and 12 weeks after planting was 50.9, 49.1, and 32.9, respectively. Plant NDVI was 0.60 at 6 weeks, 0.84 at 8 weeks, and 0.76 at 10 weeks. Plants produced an average of 189.8 CWT per acre, with an average tuber weight of 105.1 grams. Specific gravity was 1.094 with an SFA score of 3.5, with 20% HH, 10% BC, and 0% VRD.
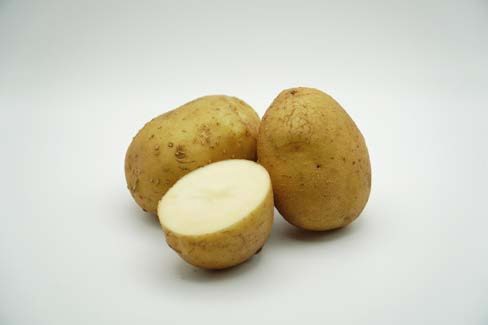
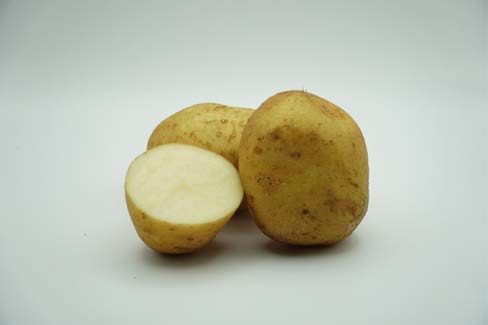
Chieftain
The germination percentage of cultivar ‘Chieftain’ was 88.1% at 30 days, and 91.3% at 45 days after planting. The average Leaf Greenness at 4, 8, and 12 weeks after planting was 56.5, 49.7, and 29.9, respectively. Plant NDVI was 0.58 at 6 weeks, 0.84 at 8 weeks, and 0.76 at 10 weeks. Plants produced an average of 179.4 CWT per acre, with an average tuber weight of 95 grams. Specific gravity was 1.071 with an SFA score of 3.5, with 0% HH, 0% BC, and 0% VRD.
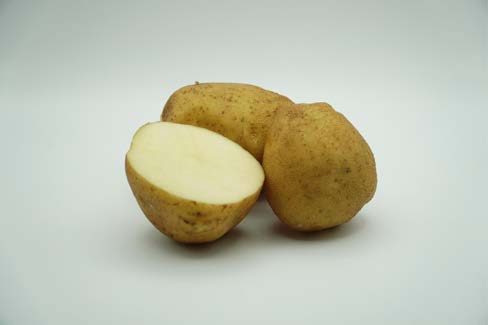
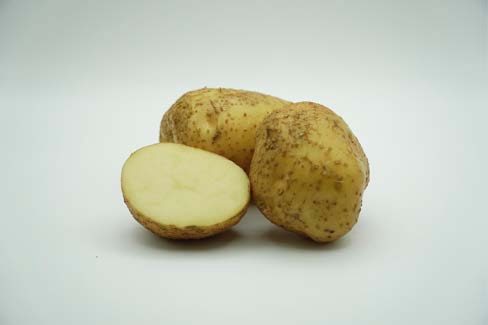
Katahdin
The germination percentage of cultivar ‘Katahdin’ was 68.8% at 30 days, and 82.5% at 45 days after planting. The average Leaf Greenness at 4, 8, and 12 weeks after planting was 51, 47.9, and 37.1, respectively. Plant NDVI was 0.55 at 6 weeks, 0.84 at 8 weeks, and 0.75 at 10 weeks. Plants produced an average of 149 CWT per acre, with an average tuber weight of 93 grams. Specific gravity was 1.078 with an SFA score of 4, with 0% HH, 0% BC, and 0% VRD.
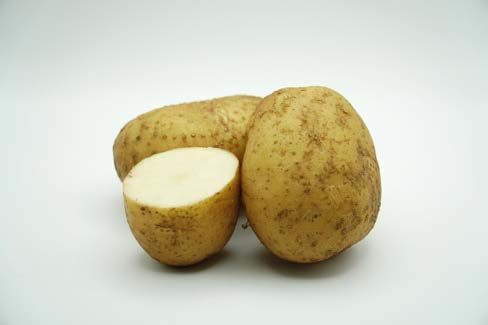
Kennebec
The germination percentage of cultivar ‘Kennebec’ was 79.4% at 30 days, and 89.4% at 45 days after planting. The average Leaf Greenness at 4, 8, and 12 weeks after planting was 53.7, 46.9, and 30.7, respectively. Plant NDVI was 0.58 at 6 weeks, 0.85 at 8 weeks, and 0.78 at 10 weeks. Plants produced an average of 170.9 CWT per acre, with an average tuber weight of 117.2 grams. Specific gravity was 1.078 with an SFA score of 4.5, with 10% HH, 0% BC, and 0% VRD.
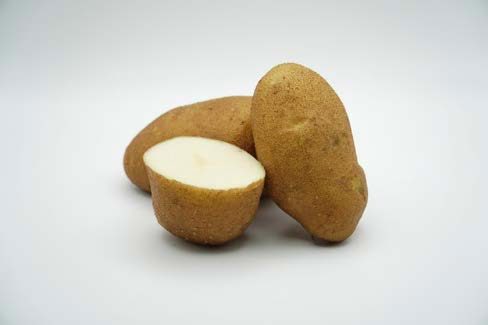
Russet Norkotah
The germination percentage of the cultivar ‘Russet Norkotah’ was 79.4% at 30 days, and 94.4% at 45 days. The average Leaf Greenness at 4, 8, and 12 weeks after planting was 55.6, 48.5, and 30.4, respectively. Plant NDVI was 0.52 at 6 weeks, 0.84 at 8 weeks, and 0.78 at 10 weeks. Plants produced an average of 195.4 CWT per acre, with an average tuber weight of 89.6 grams. Specific gravity was 1.084 with an SFA score of 5, with 0% HH, 0% BC, and 0% VRD.
Snowden
The germination percentage of cultivar ‘Snowden’ was 95.2% at 30 days, and 96.2% at 45 days after planting. The average Leaf Greenness at 4, 8, and 12 weeks after planting was 48.9, 44.8, and 30.3, respectively. Plant NDVI was 0.58 at 6 weeks, 0.85 at 8 weeks, and 0.77 at 10 weeks. Plants produced an average of 192.1 CWT per acre, with an average tuber weight of 74.1 grams. Specific gravity was 1.089 with an SFA score of 5, with 0% HH, 0% BC, and 0% VRD.
Superior

The germination percentage of cultivar ‘Superior’ was 87.5% at 30 days, and 91.2% at 45 days after planting. The average Leaf Greenness at 4, 8, and 12 weeks after planting was 53.7, 50.9, and 32.2, respectively. Plant NDVI was 0.57 at 6 weeks, 0.83 at 8 weeks, and 0.75 at 10 weeks. Plants produced an average of 196.3 CWT per acre, with an average tuber weight of 101.3 grams. Specific gravity was 1.086 with an SFA score of 5, with 0% HH, 0% BC, and 10% VRD.
AF5521-1
The germination percentage of cultivar ‘AF5521-1’ was 66.2% at 30 days, and 95% at 45 days after planting. The average Leaf Greenness at 4, 8, and 12 weeks after planting was 52.2, 51.8, and 32.1, respectively. Plant NDVI was 0.57 at 6 weeks, 0.84 at 8 weeks, and 0.75 at 10 weeks. Plants produced an average of 182.2 CWT per acre, with an average tuber weight of 121.5 grams. Specific gravity was 1.092 with an SFA score of 4, with 0% HH, 10% BC, and 0% VRD.
AF5735-8
The germination percentage of cultivar ‘AF5735-8’ was 86.9% at 30 days, and 95.6% at 45 days after planting. The average Leaf Greenness at 4, 8, and 12 weeks after planting was 50.9, 49.7, and 32.8, respectively. Plant NDVI was 0.55 at 6 weeks, 0.85 at 8 weeks, and 0.77 at 10 weeks. Plants produced an average of 125.5 CWT per acre, with an average tuber weight of 98.6 grams. Specific gravity was 1.081 with an SFA score of 5, with 0% HH, 0% BC, and 0% VRD.
AF5933-4
The germination percentage of cultivar ‘AF5933-4’ was 78.8% at 30 days, and 88.1% at 45 days after planting. The average Leaf Greenness at 4, 8, and 12 weeks after planting was 52.9, 52.5, and 31.7, respectively. Plant NDVI was 0.57 at 6 weeks, 0.85 at 8 weeks, and 0.78 at 10 weeks. Plants produced an average of 192.9 CWT per acre, with an average tuber weight of 80.8 grams. Specific gravity was 1.094 with an SFA score of 5, with 10% HH, 0% BC, and 0% VRD.
AF6194-4
The germination percentage of cultivar ‘AF6194-4’ was 75% at 30 days, and 86.9% at 45 days after planting. The average Leaf Greenness at 4, 8, and 12 weeks after planting was 49.2, 48.1, and 31.7, respectively. Plant NDVI was 0.54 at 6 weeks, 0.85 at 8 weeks, and 0.77 at 10 weeks. Plants produced an average of 203.9 CWT per acre, with an average tuber weight of 108.6 grams. Specific gravity was 1.084 with an SFA score of 3, with 10% HH, 0% BC, and 0% VRD.
AF6340-6
The germination percentage of cultivar ‘AF6340-6’ was 88.8% at 30 days, and 96.9% at 45 days after planting. The average Leaf Greenness at 4, 8, and 12 weeks after planting was 54.4, 48.1, and 27.3, respectively Plant NDVI was 0.60 at 6 weeks, 0.85 at 8 weeks, and 0.78 at 10 weeks. Plants produced an average of 200.3 CWT per acre, with an average tuber weight of 79.3 grams. Specific gravity was 1.079 with an SFA score of 5, with 0% HH, 0% BC, and 0% VRD.
AF6565-8
The germination percentage of cultivar ‘AF6565-8’ was 71.2% at 30 days, and 84.4% at 45 days after planting. The average Leaf Greenness at 4, 8, and 12 weeks after planting was 55.9, 48.9, and 32.8, respectively. Plant NDVI was 0.57 at 6 weeks, 0.84 at 8 weeks, and 0.76 at 10 weeks. Plants produced an average of 193.3 CWT per acre, with an average tuber weight of 88.3 grams. Specific gravity was 1.091 with an SFA score of 3, with 10% HH, 0% BC, and 0% VRD.
AF6601-2
The germination percentage of cultivar ‘AF6601-2’ was 83.7% at 30 days, and 92.5% at 45 days after planting. The average Leaf Greenness at 4, 8, and 12 weeks after planting was 50.4, 43.9, and 26.9, respectively. Plant NDVI was 0.56 at 6 weeks, 0.84 at 8 weeks, and 0.75 at 10 weeks. Plants produced an average of 166.9 CWT per acre, with an average tuber weight of 74.4 grams. Specific gravity was 1.089 with an SFA score of 3.5, with 0% HH, 0% BC, and 0% VRD.
BNC559-1
The germination percentage of cultivar ‘BNC559-1’ was 75% at 30 days, and 85.6% at 45 days. The average Leaf Greenness at 4, 8, and 12 weeks after planting was 55.9, 52.5, and 37.2, respectively. Plant NDVI was 0.55 at 6 weeks, 0.83 at 8 weeks, and 0.73 at 10 weeks. Plants produced an average of 146.9 CWT per acre, with an average tuber weight of 91 grams. Specific gravity was 1.075 with an SFA score of 3.5, with 0% HH, 0% BC, and 0% VRD.
BNC917-2
The germination percentage of cultivar ‘BNC917-2’ was 76.9% at 30 days, and 84.4% at 45 days. The average Leaf Greenness at 4, 8, and 12 weeks after planting was 53.1, 47.6, and 31.7, respectively. Plant NDVI was 0.56 at 6 weeks, 0.84 at 8 weeks, and 0.76 at 10 weeks. Plants produced an average of 177.1 CWT per acre, with an average tuber weight of 95.5 grams. Specific gravity was 1.073 with an SFA score of 4, with 10% HH, 0% BC, and 0% VRD.
MSAFFB635-15
The germination percentage of cultivar ‘MSAFFB635-15’ was 68.1% at 30 days, and 79.4% at 45 days. The average Leaf Greenness at 4, 8, and 12 weeks after planting was 54.7, 52.6, and 42.8, respectively. Plant NDVI was 0.53 at 6 weeks, 0.83 at 8 weeks, and 0.71 at 10 weeks. Plants produced an average of 161.5 CWT per acre, with an average tuber weight of 82.7 grams. Specific gravity was 1.089 with an SFA score of 4, with 10% HH, 0% BC, and 0% VRD.
NDAF141Y-3
The germination percentage of cultivar ‘NDAF141Y-3’ was 81.2% at 30 days, and 87.5% at 45 days. The average Leaf Greenness at 4, 8, and 12 weeks after planting was 50.6, 51.8, and 32.74, respectively. Plant NDVI was 0.57 at 6 weeks, 0.84 at 8 weeks, and 0.77 at 10 weeks. Plants produced an average of 156.3 CWT per acre, with an average tuber weight of 90.3 grams. Specific gravity was 1.078 with an SFA score of 4.5, with 0% HH, 0% BC, and 0% VRD.
NY171
The germination percentage of cultivar ‘NY171’ was 71.9% at 30 days, and 85% at 45 days. The average Leaf Greenness at 4, 8, and 12 weeks after planting was 49.4, 46.3, and 31.9, respectively. Plant NDVI was 0.53 at 6 weeks, 0.83 at 8 weeks, and 0.76 at 10 weeks. Plants produced an average of 113.6 CWT per acre, with an average tuber weight of 103.5 grams. Specific gravity was 1.076 with an SFA score of 4, with 0% HH, 0% BC, and 0% VRD.
NY174
The germination percentage of cultivar ‘NY174’ was 81.9% at 30 days, and 92.5% at 45 days. The average Leaf Greenness at 4, 8, and 12 weeks after planting was 54.5, 51.6, and 36.7, respectively. Plant NDVI was 0.53 at 6 weeks, 0.83 at 8 weeks, and 0.73 at 10 weeks. Plants produced an average of 206.8 CWT per acre, with an average tuber weight of 104.9 grams. Specific gravity was 1.086 with an SFA score of 3. Potatoes showed 0% hollow heart, 0% brown center, and 0% vascular ring discoloration.
NY177
The germination percentage of cultivar ‘NY177’ was 62.5% at 30 days, and 68.1% at 45 days. The average Leaf Greenness at 4, 8, and 12 weeks after planting was 49.8, 47.8, and 38.1, respectively. Plant NDVI was 0.56 at 6 weeks, 0.84 at 8 weeks, and 0.75 at 10 weeks. Plants produced an average of 153 CWT per acre, with an average tuber weight of 96.2 grams. Specific gravity was 1.092 with an SFA score of 3.5. Potatoes showed 0% hollow heart, 0% brown center, and 0% vascular ring discoloration.
Acknowledgments
This research was supported by the intramural research program of the U.S. Department of Agriculture, National Institute of Food and Agriculture, Potato Breeding to Improve Marketability and Resilience to Environmental Stress, Pests, AWARD NUMBER: 2021-34141- 35448.
References
Climate Data. 2023. Climate Eastern Shore (Virginia). Available at: http://www.virginiaplaces.org/climate/ Visited on Sept 25, 2023.
Department of Primary Industries and Regional Development. 2016. Hollow Heart in Potatoes. Available at: https://www.agric.wa.gov.au/potatoes/hollow-heart-potatoesVisited on Sept. 26, 2023.
GISGeography. 2023. What is NDVI (Normalized Difference Vegetation Index)?. Available at: https://gisgeography.com/ndvi-normalized-difference-vegetation-index/. Visited on Sept 26, 2023.
University of Nebraska – Lincoln. 2023. Vascular Discoloration. Available at: https://cropwatch.unl.edu/potato/vascular_discoloration.Visited on Sept. 26, 2023.
Wayumba, B.O. H.S. Choi, L.Y. Seok. 2019. Selection and Evaluation of 21 Potato (Solanum Tuberosum) Breeding Clones for Cold Chip Processing. Foods 2019, 8, 98.
Wilson, J.H., and A.M. Lindsay. 1969. The relation between specific gravity and dry matter content of potato tubers. American Potato Journal 46, 323–328. https://doi.org/10.1007/BF02862002.
Xiong, D., J. Chen, T. Yu. 2015. SPAD-based leaf nitrogen estimation is impacted by environmental factors and crop leaf characteristics. Sci Rep 5, 13389. https://doi.org/10.1038/srep13389
Zotarelli, L., C. Hutchinson, S. Byrd, D. Gergela, and D. L. Rowland. 2012. Potato Physiological Disorders – Brown Center and Hollow Heart. Available at: https://edis.ifas.ufl.edu/publication/HS197. Visited on Sept. 26, 2023.
Virginia Cooperative Extension materials are available for public use, reprint, or citation without further permission, provided the use includes credit to the author and to Virginia Cooperative Extension, Virginia Tech, and Virginia State University.
Virginia Cooperative Extension is a partnership of Virginia Tech, Virginia State University, the U.S. Department of Agriculture, and local governments. Its programs and employment are open to all, regardless of age, color, disability, sex (including pregnancy), gender, gender identity, gender expression, national origin, political affiliation, race, religion, sexual orientation, genetic information, military status, or any other basis protected by law
Publication Date
October 18, 2023