
Understanding Climate Change Projections in Virginia
ID
BSE-342P
 EXPERT REVIEWED
Across Virginia, the climate is changing in many ways. While weather conditions have always deviated from year to year, many of the developments being experienced now go beyond these variations. Instead, they are evidence of long-term climate change. One of the most widely known impacts of climate change is a rise in temperatures, but this is not the only way that the climate is changing. Rising sea levels along Eastern Virginia put locations at low elevations, particularly the Hampton Roads area, at a greater risk of flooding. Climate change is also expected to impact the timing and amount of rainfall Virginia receives, as well as extreme weather events like hurricanes and droughts. These changes will in turn impact many other things that are affected by weather conditions, such as water quality, natural habitats, food production, disease transmission, and infrastructure.
Climate change could have a large impact on Virginia, but there are also many things that can be done to help the commonwealth prepare for and be more resilient to a changing climate. A first step in preparing is to understand how the climate is already changing and how it will likely change in the future. This can help Virginians be better prepared to address direct and indirect impacts of a changing climate. However, it is important to understand both what we do and do notknow about climate change and how it might impact us.
The objectives of this bulletin are to:
Describe the basic science of climate change.
Explain how scientists estimate future climate change.
Present data on projected temperature and rainfall changes for the coming century in Virginia.
Explain limitations and issues to consider when using climate change projections to inform decision- making.
Basics of Climate Change
Climate change is occurring because of more greenhouse gases in the Earth’s atmosphere. The most well-known impact of climate change is an increase in the Earth’s temperature. Rising levels of greenhouse gases in the atmosphere have been observed since the Industrial Revolution in the mid-1700s, when new manufacturing processes obtained energy by burning fossil fuels such as coal and oil. Fossil fuels contain greenhouse gases, such as carbon dioxide and methane, that are released into the Earth’s atmosphere when the fuel is burned. These gases cause energy radiating from the Earth to be trapped in the atmosphere rather than returning to space. This concept, known as the Greenhouse Effect, results in an increase in Earth’s temperature. The average amount of carbon dioxide in the atmosphere was roughly 280 parts per million (ppm) before the Industrial Revolution. In 2018, the average amount had reached roughly 407 ppm. This is greater than it has been in more than 400,000 years (USEPA 2016). To put this in perspective, the earliest known fossils of Homo sapiens are just 300,000 years old.
The Earth’s temperature has always varied. This has led to periods where the planet was cooler (ice ages) or warmer. However, the change in temperature over the past 100 years, a 1.2 degree Fahrenheit increase (Hayhoe et al. 2017), has occurred much faster than it has historically (Lindsey 2020). Scientists have investigated other possible reasons for this warming, including factors like changing radiation from the sun or variations in the orbit and tilt of the Earth. Research consistently shows that current warming can only be explained by higher levels of greenhouse gases in the atmosphere.
Impacts of Climate Change
Climate change not only impacts the temperature of the Earth, but it also has other effects. Rising temperatures are causing sea levels to rise through both the expansion of water in the oceans and the melting of glaciers and polar ice sheets. Rising temperatures also impact weather cycles, potentially altering the location, timing, and intensity of rainfall. Extreme weather events, such as thunderstorms, hurricanes, droughts, and wildfires, are becoming stronger and more frequent. While extreme weather has always occurred, climate change makes these events more severe. For instance, scientists estimate that twice as many acres are lost to forest fires in the Western U.S. each year because of climate change (Abatzoglou and Williams 2016). Similarly, researchers have shown that climate change likely resulted in an additional 12 inches of rainfall in 2017’s Hurricane Harvey compared with what would have occurred if the atmosphere was cooler (Risser and Wehner 2017). Extreme weather creates many issues, such as flooding, damaged infrastructure, decreased water quality, and increased spread of disease. It is evident that greenhouse gases have several impacts, not only on Earth’s temperature but on weather patterns in general.
It is important to understand the difference between weather and climate when discussing climate change. Weather refers to short-term conditions at a specific location and time. In contrast, climate is defined by long-term averages of rainfall, temperature, and other weather conditions. So, weather is that occasional very cold — or unusually warm — winter day, whereas climate is the long-term observations of seasonal temperatures. These changes in climate have led to revisions to the USDA Plant Hardiness Zone maps, which categorize different regions in the country based on average temperatures over the long term.
Projecting Future Climate Change
Long-term air temperature and sea-level data show clear increases over most of the globe in the past 100 years and confirm that our climate is changing. In many situations, we may want to know how these changes will continue in the future. This is particularly true when making plans or decisions that have long-term consequences, such as infrastructure investment or municipal zoning rules. To understand and project how the climate might change in the future, scientists use complex computational climate models. These models use mathematical equations to represent Earth’s physical properties that control climate. Climate models can be used to project how climate conditions may change in the future when given certain inputs, such as greenhouse gas emissions. Many research organizations across the globe have developed and use different climate models. These organizations coordinate the experiments that they run on their models so that the results from different climate models can be compared. In the United States, the National Oceanic and Atmospheric Administration (NOAA), National Aeronautics and Space Agency (NASA), the National Center for Atmospheric Research, and many national laboratories have developed and run their own climate models. Using multiple climate models to estimate future climate change impacts is referred to as ensemble modeling. Because no model is perfect, ensembles can provide us with a range of possible changes in the climate. These models are continually being updated and refined to make them more accurate and reliable.
Simulations can be used to project how temperature, rainfall, and other climate characteristics respond to increased greenhouse gas emissions. Climate models are also used to simulate how oceans respond to climate change, providing estimates of future sea level rise. In addition, climate models are used to run “hindcast” simulations, which plug in greenhouse gas levels from past years to see how well the models replicate the historical observed climate. These hindcasts can be used to identify areas where the models produce errors and fix them through calibration or model refinement.
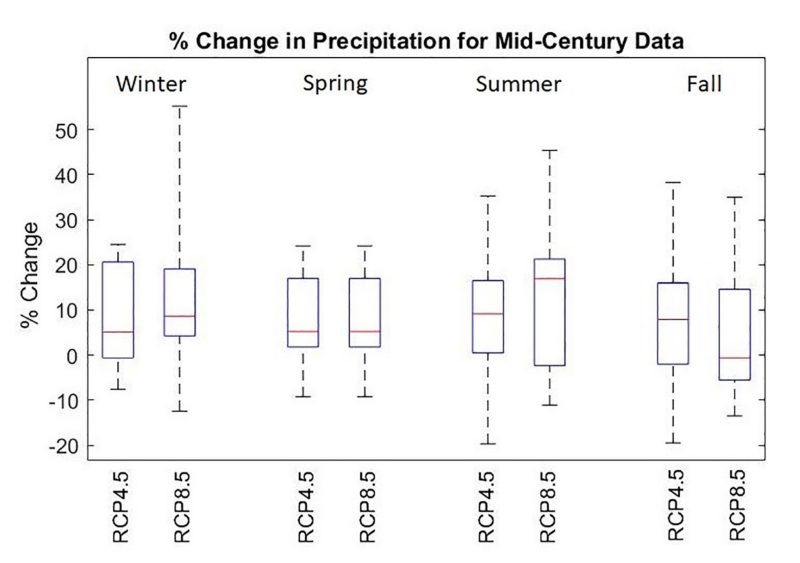
Using climate model data for decision-making requires information at an appropriate geographic scale. For instance, water supply planners may want to know how much rainfall and streamflow will be available in a specific river basin, or public health officials may be concerned about heat waves in their city. These situations typically require more spatially detailed climate data than can be obtained directly from climate models. Climate model downscaling is a method that is used to rescale climate model projections to obtain local climate details. For instance, Figure 1a shows temperature data at a lower resolution of 100 kilometers, while Figure 1b shows downscaled temperature data at a higher resolution of 25 km. The higher spatial resolution in Figure 1b allows weather patterns, such as lower temperatures in areas of the Appalachian Mountains, to be more easily seen.
Downscaling is typically very important for accurately understanding climate impacts at finer spatial scales, i.e., state, county, or town. Downscaled climate model projections can be used as inputs for models that simulate things like river flows, crop yields, flooding, and health impacts. This process is referred to as impact modeling. Impact modeling allows scientists to better understand how changes in the climate will impact things like food production, water availability, and flood damage.
To simulate the Earth’s future climate using climate models, scientists have to make assumptions about the amount of greenhouse gases that will be released into the atmosphere. If emissions go down, the Earth will not warm as much. If they go up, the Earth will warm more quickly, and climate change impacts will be more severe. For instance, by 2100, high levels of greenhouse gas emissions are expected to result in a global rise in sea level between 1.71 and 3.22 feet. In comparison, a rapid decline in greenhouse gas emissions would lead to sea level rise between 0.85 feet and 1.80 feet (Church and Gregory 2019). Larger impacts will typically require more adaptation to avoid negative outcomes, such as damage to property and infrastructure, health risks, crop failure, and water shortages.
It is difficult to estimate exactly how greenhouse gas emissions will change, so climate models are used to simulate future climate under different emissions scenarios. These emissions scenarios are called “representative concentration pathways,” or RCPs. Each RCP is based on different assumptions about future greenhouse gas emissions. For example, the RCP 2.6 scenario represents lowest amounts of future greenhouse gas emissions. This scenario would occur if countries strongly reduced greenhouse gas emissions by rapidly switching to clean energy sources and capturing some of the greenhouse gas already present in the atmosphere. The RCP 8.5 scenario represents a scenario wherein little effort is made to reduce emissions, resulting in very large atmospheric greenhouse gas concentrations. The RCP 4.5 emissions scenario is between RCP 2.6 and RCP 8.5 and assumes a gradual shift to renewable energy that results in greenhouse gas emissions declining by 2050.
While there is uncertainty in how the climate may change in future years, climate models and RCP emission scenarios can provide insight to how things like temperature and sea level will change in the decades to come under various greenhouse gas emission levels.
The process of downscaling climate model projections can provide data at the scales needed for local and regional planning. While we can’t know for sure how greenhouse gas emissions will continue in the future, scientists use multiple emissions scenarios to understand the range of possible changes that could occur. In general, higher emissions levels lead to greater impacts and a larger need for adaptative actions in response.
Projections of Future Climate Change in Virginia
Evaluating a range of climate scenarios can help in understanding how the climate of Virginia might change in the future, which can help the commonwealth prepare for potential climate change impacts. Virginia is experiencing a variety of climate change-related trends. These include increased sea level, higher temperatures, and changing precipitation patterns. The following information on potential climate changes in Virginia is based on climate data from the NASA Earth Exchange project. Daily temperature and precipitation data from 1981 to 2005 represent Virginia’s historical climate. This historical climate data was compared to mid-century (2041-2060) climate projections from an ensemble of 21 climate models using the RCP 4.5 and RCP 8.5 emissions scenarios.
Temperature
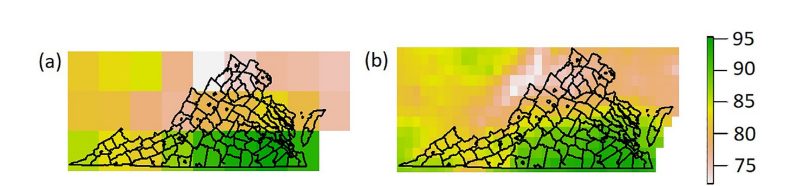
Even though climate models project different changes in temperature in the future, they all agree that temperatures will increase. The amount of warming depends on the simulated emissions scenario, and it is important to note that future warming will not be uniform across the entire year. Figure 2 illustrates differences in the temperature projections across the different climate models used in the ensemble of 21 climate models for each season of the year in Richmond, Virginia. The vertical axis shows the predicted difference in degrees (Fahrenheit) between mid-century (2041-2060) and historical (1981-2005) temperatures. The horizontal axis shows results for the two model emissions scenarios by season. The line in the middle of each box shows the median of the climate model ensemble — in other words, half of the climate models project temperature differences greater than this line, while the other half project increases less than this value. The outer boundaries of the boxes represent the 25th and 75th quartiles of the predictions — 25% of the climate models project temperature changes less than the bottom of each blue box, and 25% of models project changes greater than the top line of each the box. The ends of the dashed lines extending from the boxes represent the maximum and minimum among all of the climate model projections.
Figure 2 shows the variation in the predictions for average temperatures for mid-century (2041-2060) across all climate models. Not surprisingly, the RCP 8.5 scenario (more greenhouse gas emissions) produces larger temperature increases than RCP 4.5 scenarios in every season; the increase in greenhouse gas emissions correlates with a larger temperature increase. However, there is a large spread in the predicted temperature changes across different models. For instance, under the RCP 8.5 scenario, winter temperatures are expected to increase anywhere from 1.5 degrees Fahrenheit to 6.0 F, with a median value of slightly more than 4.0 F. Temperature increases are typically higher in the summer and fall months, relative to winter and spring months. Although not all models project the same values for temperature changes, they all project that temperatures will increase.
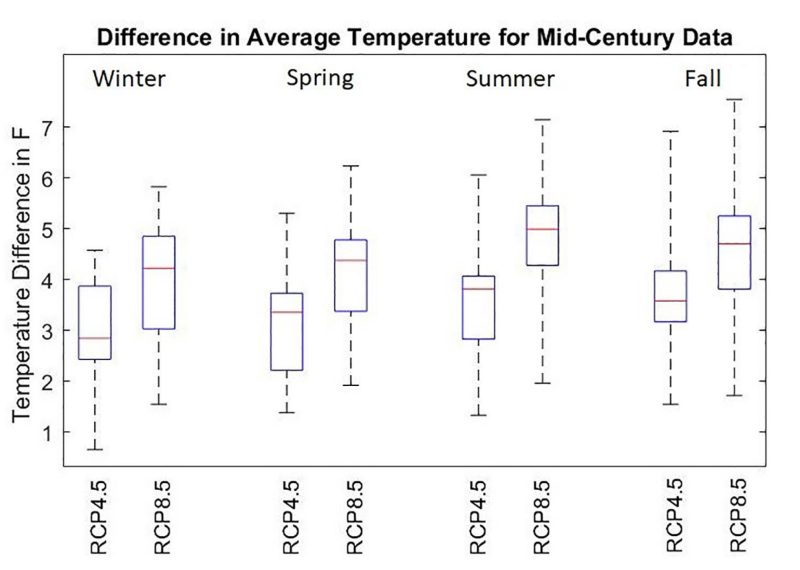
Figure 2 shows changes in temperatures averaged over a period of 20 years. While these changes may seem small, they can have a large impact on the day-to-day temperatures that we experience. Table 1 shows data from a single climate model indicating how a small change in average temperature can lead to large changes in the frequency of very hot days. This model projected an increase in annual average temperature of 4.3 degrees Fahrenheit, which is a moderate change in temperature relative to other climate models. However, in this scenario, the number of days per year with temperature above 90 degrees increases from 32 to 78. This shows that even a moderate increase in long-term average temperatures can lead to a large increase in extreme temperatures.
| Change | Hindcast years | Mid-century |
|---|---|---|
Average annual temperature |
69.5 °F |
73.8 °F |
Days per year between 80°F and 90°F |
94 |
72 |
Days per year over 90°F |
32 |
78 |
Precipitation
Climate models also differ in terms of how precipitation will change in the future. Figure 3 shows the percent change in precipitation by mid-century (2041-2060) across different models, seasons, and emissions scenarios. A percent change greater than zero indicates more precipitation, while a percent change less than zero indicates less precipitation.
Most climate models predict increases in precipitation in Virginia under each emissions scenario and season. The median climate model projection predicts more precipitation for all seasons and emissions scenarios except RCP 8.5 during fall. However, looked at individually, some models predict decreases in precipitation in almost all seasons. By comparing figures 2 and 3, it is clear that there is considerably more uncertainty regarding future precipitation compared with future temperature. Even though many models suggest that rainfall will increase in Virginia, there is the possibility that climate change will result in less rainfall.
A decline in rainfall, particularly during the spring or summer, could impact agricultural production and the amount of water available in rivers and streams. On the other hand, increasing rainfall could lead to more flooding, particularly in the winter and spring. The range of potential changes across different models suggest that we should be prepared for many possible impacts from changing precipitation.
Geographic Changes
The previous sections reviewed climate projections for a single location (Richmond, Virginia). However, climate change will have an impact statewide. Figure 4 illustrates a combination of temperature analyses across Virginia. The top two maps show hindcast (a) and mid- century projections (b) for average annual temperatures across the commonwealth. Much of the yearly average temperature in the Piedmont and Tidewater region generally ranged from 68 to 72 degrees Fahrenheit in the historical projections, with lower temperatures (60-68 F) in the mountains. On the other hand, by mid-century (2041-2060), temperatures in the Piedmont and Tidewater are projected to increase to 72-76 F. The mountainous parts of the state mostly increase to 68-72 F. A rise of 4 F may be hard to picture, but one can imagine that by the middle of the century the Valley and Ridge regions would experience temperatures similar to what the Piedmont and Tidewater regions experience now. This can lead to changes in the types of plants and animals that are present in these locations, impacting both natural ecosystems and agriculture. For instance, multiple studies have found that warm-climate insects that are harmful for crops are spreading northward as the climate warms.
The bottom two maps in figure 4 show historical (c) and future (d) estimates of the number of days that the maximum air temperature exceeds 90 F. Historically, most of Virginia experienced approximately 30 days of maximum temperature over 90 F per year, on average. By mid-century, much of the state is expected to experience this for 60-90 days per year. Some mountainous areas will experience hot days as often as the Piedmont region does currently. In large parts of the state, the number of hot days will be greater than what any part of the state experiences currently. These hot days can present a health risk, particularly for seniors, outdoor workers, or those without air conditioning.
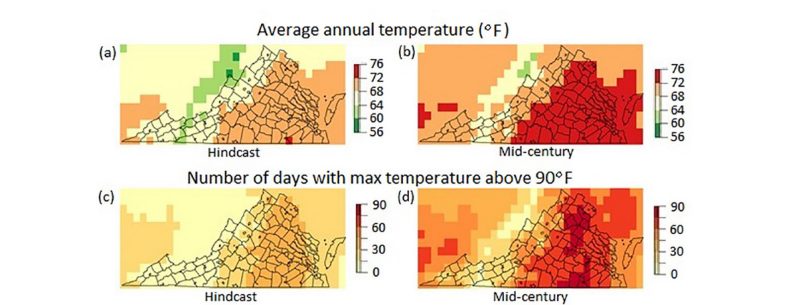
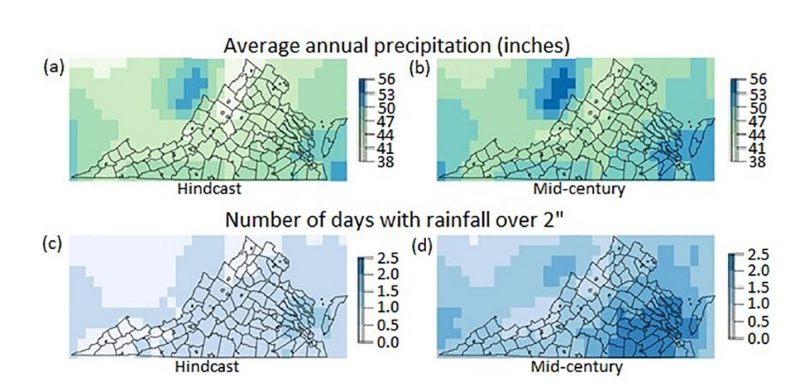
Figure 5 shows analyses of past and future precipitation conditions in Virginia. The top left map (a) shows that historically, average annual precipitation ranged from 41-47 inches across the commonwealth. By mid-century (b; 2041-2060), average annual precipitation increases to 44-53 inches. This is the average projected change from all climate models in the ensemble. Because of this, figure 5 does not show the individual climate models that project a decline in precipitation that were apparent in figure 3. The bottom two maps show hindcast and mid-century (2041-2060) projections on the number of days per year with rainfall greater than 2 inches. This type of intense rainfall can cause flooding and problems for roads, sewers, buildings, and agriculture. The number of days with rainfall greater than 2 inches is historically between 0.5-1.5 days per year (c). By mid-century this is projected to increase to 1-2.5 days per year (d). The Tidewater region shows an especially high increase in intense rainfall days, illustrating the uneven nature of climate change impacts across the commonwealth. This demonstrates why downscaling climate model data is important for local planning purposes, as these patterns would be less noticeable using lower-resolution data spread over larger areas.
Issues to Consider When Using Climate Change Data
Climate models are powerful tools for understanding how the Earth’s climate is likely to respond to greenhouse gas emissions. The information they provide can help us understand how our climate is likely to change in the future and what actions might be needed to mitigate negative outcomes. This can be particularly important in planning decisions with long-term consequences. However, there are certain issues that should be considered when interpreting climate projections. One issue is that climate change projections are inherently uncertain. Although scientists are confident that climate change is occurring, it is impossible to predict exactly how greenhouse gas emissions will continue in the future. Additionally, the Earth’s climate system is very complex and difficult to simulate. Even if we knew exactly how emissions would change in the future, existing models, because of the way they were developed and their inherent assumptions, would differ in their predictions. This is why different climate models do not provide the exact same predictions, as illustrated in figures 2 and 3. Because of this uncertainty, and it is becoming increasingly common to use ensemble modeling to project a range of possible outcomes.
Another issue is that climate models tend to be more accurate and consistent for certain weather conditions and less certain for others. For instance, there is more agreement between climate model projections of future temperatures in Virginia compared with future rainfall. Certain weather events, such as extreme storms and hurricanes, are more difficult to model, and climate model projections for these types of events are more uncertain. Generally, when climate model hindcasts are consistent with historical data, we have more confidence in that climate model’s ability to estimate that weather variable in the future.
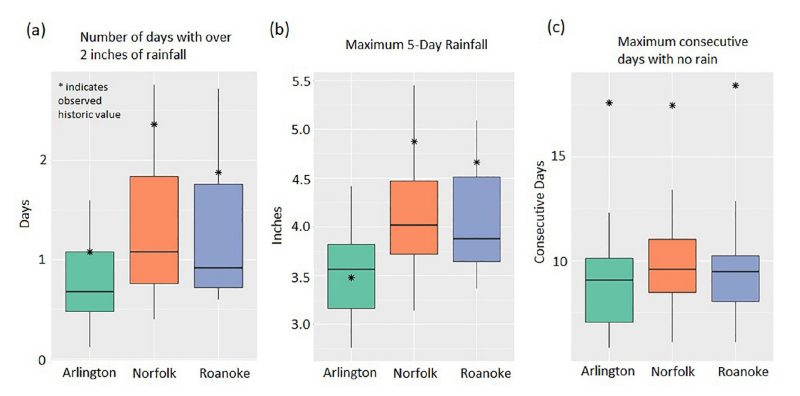
To compare climate model hindcasts with historical weather conditions, figure 6 uses boxplots with hindcast data and historical data for three different locations. The boxplot on the left, (a), shows the range of model hindcast data on the number of days per year where rainfall exceeded 2 inches across an ensemble of 21 climate models. The actual number of days when rainfall exceeded 2 inches, based on historical data, is shown with an asterisk. In Arlington, rainfall greater than 2 inches occurred, on average, about 1.1 days per year. However, 75% of climate model hindcast values assumed less than this value. This difference between historical data and model hindcasts is even more severe in Norfolk and Roanoke. The center boxplot, (b), shows the maximum five-day rainfall; in other words, the most rainfall that occurs over a consecutive five-day period each year. Most climate model hindcasts underestimated this value in Norfolk and Roanoke. On the whole, this shows how climate models tend to underestimate the occurrence of heavy rainfall events. The boxplot on the right, (c), shows the maximum number of consecutive days per year with no rainfall. In Roanoke, the longest annual dry spell was, on average, 18 days according to historical data. However, every hindcast at all three locations predicted dry spell durations far less than what the historical data shows actually occurred.
Most climate models are consistent in projecting a general trend of increasingly intense rainstorms as the atmosphere warms. However, the discrepancy between model simulations and observed weather leads to uncertainty in quantitative estimates of just how much more intense these storms will become. In other words, we can confidently expect more frequent heavy rainstorms in general, but specifically estimating how frequent they will be is much more difficult. While certain decisions may require quantitative estimates of future climate conditions (particularly in the case of expensive infrastructure planning), other contexts may require only general information on future climate trends. That said, many climate trends in Virginia are consistent across climate models and historical data, such as rising temperatures, more frequent heat waves, more intense rainfall, and rising sea levels. Thus, while we may not be able to say exactly what the average temperature will be in 50 years or how often high- intensity rainfall will occur, these general trends should be considered when making planning or investment decisions with long-term consequences.
Conclusion
Climate change is already impacting Virginia and will continue to do so in the future. The impacts of climate change include higher temperatures, changing rainfall patterns, and higher sea levels, causing frequent flooding, reduced water supply, poorer water quality,
and decreased food production. The science underlying climate change is well understood. Many climate trends, such as higher temperatures and rising sea levels, can be seen in observed data.
To understand how the climate will change in the future, scientists use climate models that simulate the Earth’s climate under different assumptions about greenhouse gas emissions. Climate models can be powerful tools in understanding how our future climate may look compared with today. While climate models tend to be more accurate when predicting certain climate changes (i.e., temperature and sea levels), other changes, like precipitation, have a higher degree of uncertainty. As a result, climate models have limitations in their output and must be put in context for proper interpretation.
Despite the inherent uncertainties in climate model projections, understanding how the climate is likely to change in the future is an important step in preparing for possible future scenarios.
Acknowledgments
The authors would like to thank the following individuals for their thoughtful review and comments on this publication: Carol Davis, Sustainability Manager, Town of Blacksburg; Zach Easton, Professor and Extension Specialist, Virginia Tech; Robbie Longest, Agriculture and Natural Resource Extension Agent, Essex County; and Diana Rashash, Water Quality Specialized Agent, North Carolina State University Extension. Their contributions are gratefully acknowledged.
Glossary
Climate: Refers to long-term weather patterns and conditions, such as averages of rainfall and temperature, over many years.
Downscaling: A method used to obtain locally specific predictions in climate changes from climate models. This provides finer spatial detail over smaller regions rather than larger, general areas.
Climate Model: Highly complex computer models that represent Earth’s physical properties as mathematical equations. Climate models use a grid approach to simulate the movement of energy and moisture around the world. This is used to estimate how temperature, rainfall, and other weather characteristics at different locations will respond to increased greenhouse gas emissions in the future.
Greenhouse Gases: Gases, such as carbon dioxide and methane, that enter into Earth’s atmosphere. These gases cause energy radiating from the Earth to be trapped in the atmosphere, rather than returning to space. This concept, known as the Greenhouse Effect, results in an increase in Earth’s temperature.
Hindcast: Climate model simulations of historical climate. These are used to evaluate how well models replicate observed climate and identify model errors and inaccuracies.
Impact Modeling: A method used to understand how climate change will impact other things, like water supply and quality, flooding, human health, and crop production.
Representative Construction Pathways (RCP): Different emissions scenarios that are based on different assumptions about greenhouse gas emissions in the future. These different scenarios impact the results of climate models and how drastically the climate will change in future years.
Weather: The events that happen in the atmosphere daily. It refers to short-term events in a specific location and time.
References
Abatzoglou, J. T., and A. P. Williams. 2016. “Impact of Anthropogenic Climate Change on Wildfire across Western U.S. Forests.” Proceedings of the National Academy of Sciences 113: 11770-11775.
Church, J. A., and J. M. Gregory. 2019. Sea Level Change. Encyclopedia of Ocean Sciences, Third Edition, 493-499. https://doi.org/10.1016/B978-0-12-409548-9.10820-6.
Hayhoe, K., J. Edmonds, R. E. Kopp, A. N. LeGrande, B. M. Sanderson, M. F. Wehner, and D. J. Wuebbles. 2017. “Climate Models, Scenarios, and Projections.” In Climate Science Special Report: Fourth National Climate Assessment, Volume I, edited by D. J. Wuebbles, D. W. Fahey, K. A. Hibbard, D. J. Dokken, B. C. Stewart, and T. K. Maycock, 133-160. U.S. Global Change Research Program. https://doi.org/10.7930/J0WH2N54.
Lindsey, R. 2020. “Climate Change: Atmospheric Carbon Dioxide.” NOAA Climate.gov. https://www.climate.gov/news-features/understanding-climate/climate-change-atmospheric-carbon-dioxide.
PRISM Climate Group. 2021. PRISM Climate Data. Oregon State University. http://prism.oregonstate.edu/.
Risser, M. D., and M. F. Wehner. 2017. “Attributable Human-Induced Changes in the Likelihood and Magnitude of the Observed Extreme Precipitation during Hurricane Harvey.” Geophysical Research Letters 44: 12,457-12,464.
USEPA (U.S. Environmental Protection Agency). 2016. “Climate Change Indicators: Atmospheric Concentrations of Greenhouse Gases.” https://www.epa.gov/climate-indicators/climate-change-indicators-atmospheric-concentrations-greenhouse-gases.
Virginia Cooperative Extension materials are available for public use, reprint, or citation without further permission, provided the use includes credit to the author and to Virginia Cooperative Extension, Virginia Tech, and Virginia State University.
Virginia Cooperative Extension is a partnership of Virginia Tech, Virginia State University, the U.S. Department of Agriculture, and local governments. Its programs and employment are open to all, regardless of age, color, disability, sex (including pregnancy), gender, gender identity, gender expression, genetic information, ethnicity or national origin, political affiliation, race, religion, sexual orientation, or military status, or any other basis protected by law.
Publication Date
December 21, 2021