Spray Water Quality and Pesticide Characteristics
ID
BSE-350P
 EXPERT REVIEWED
Introduction
Some pesticides can be affected by the quality of the water used for the spray mix. Pesticides, including insecticides, fungicides, and herbicides, function best when mixed with water of a compatible chemistry. Water available from surface sources (such as ponds or streams) or groundwater sources (drilled or bored wells) may have chemical characteristics that can reduce the pesticide’s efficacy. Testing water quality and understanding the characteristics of pesticides can help producers effectively control pests, reduce costs, and limit potential environmental impacts from excessive use of pesticides.
Key Characteristics of Spray Water to Consider
Water is the carrier used in many pesticide applications, so water quality plays an important role in pesticide performance. Several issues can indicate a compatibility problem between pesticides and spray water quality:
- The pesticide does not work at labeled rates.
- The product is difficult to mix or clogs nozzles.
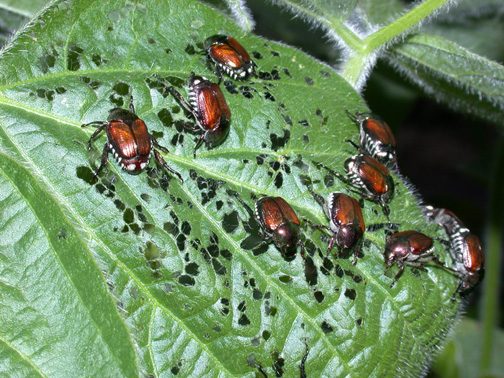
- Fields or plots experience inconsistent pest control (fig. 1).
- Pests seem resistant to a new pesticide active ingre- dient.
- Crops are lower quality or lower yielding.
Even if the mixing water appears clear, dissolved solids or other compounds may be present and reduce the effectiveness of the spray mixture. Analytical testing of water sources provides vital information that can improve pesticide performance. Testing your source water can provide information about chemical stability such as pH, total dissolved solids, hardness, and mineral content.
As always, read pesticide labels for information regarding specific products before using the products or proceeding with any recommendations.
pH
A solution’s degree of acidity or alkalinity is its pH, defined as a measure of hydrogen (H+) and hydroxide (OH-) ions. Water with a greater concentration of hydrogen ions is considered to be acidic (pH less than 7), while water with a greater concentration of hydroxide ions is considered alkaline (pH greater than 7). The logarithmic scale measuring pH ranges from 0 to 14; a pH of 7.0 is considered neutral. The pH of spray water plays an important role in the function and stability of pesticides; it can chemically alter the pesticide molecules in a spray water mixture, resulting in potential pesticide degradation or an inability to penetrate the target pest (Whitford et al. 2009).
Most pesticides are weakly acidic or neutral, and they are most stable in slightly acidic pH solutions ranging from 4-6.5 (Whitford et al. 2009). If mixed with alkaline water, some pesticides immediately begin to break down in a process called alkaline hydrolysis. Bonds holding the pesticide molecules together break apart, reducing the half-life of the pesticide. The more alkaline the water, the quicker the degradation. Surface water and groundwater can sometimes reach alkaline pH values of 8 or greater.
In these conditions, the rate of pesticide degradation due to alkaline hydrolysis in a spray water mixture may increase tenfold with every one unit of increase in pH (McKie and Johnson, 2014). Organophosphates (e.g., malathion, acephate), carbamates (e.g., carbaryl), many fungicides, and salt-based herbicides (e.g., glyphosate, imazethapyr, glufosinate) are especially susceptible to alkaline hydrolysis. Simply put, alkaline water should not be used with weak-acid pesticides. Alkaline hydrolysis is permanent and irreversible, so if the water’s pH is greater than 7, it is important to find an alternative water source or add adjuvants to lower the pH.
Acidic water can also affect the stability and physical properties of certain pesticides. For example, a pH below 5 can lead to gelling of 2,4-D amines, especially when mixed with other salt-based products (e.g., glyphosate, imazethapyr, glufosinate). Copper-based fungicides may become phytotoxic to crops if acidified by water with low pH (McGrath 2022). As pH decreases, the solubility of copper increases, and excessive amounts of copper ions can be released, potentially damaging crop foliage (Cornell Cooperative Extension 2013). Likewise, to reduce the risk of leaf burn, sprays containing lime or lime sulfur should not be acidified.
Water from both ground and surface sources may contain negatively charged ions (anions), such as chloride, or positively charged ions (cations) like calcium that can shift water pH levels to more acidic or alkaline levels. The pH of groundwater can vary across Virginia and is largely driven by geology. Most groundwater comes from precipitation, which recharges aquifers through the soil and bedrock, resulting in varying pH levels.
Groundwater in the Valley and Ridge’s carbonate-karst area tends to be neutral or alkaline, while groundwater in the Piedmont and Blue Ridge’s crystalline bedrock is often acidic. In the Coastal Plain, unconsolidated and semi-consolidated aquifers contain groundwater with pH that varies greatly at different depths (Pieper et al. 2016). The pH of surface water can vary based on precipitation timing, amount, runoff events, and other natural or human-influenced processes. Groundwater exposure to air, or precipitation or runoff impacting surface water, may also cause shifts in pH.
To test the pH of source water used for spray water mixing, producers can use pH litmus strips or, for higher precision, a calibrated pH meter. A more thorough water analysis done through VT-SWAP (http://www.wellwater.bse.vt.edu/swap) or a private laboratory can also be used to evaluate pH. Due to dissolved gases such as carbon dioxide in the water and other interfering factors, pH can change very rapidly once a sample is collected. For the most accurate results, pH measurements should be taken as quickly as possible following sample collection. If water has been sitting in a storage tank, it is advisable to test the pH again before adding any products. For more information on how to test and adjust the pH of your water, see Virginia Tech publication 352-P, “Solving Spray Water Problems.”
Water Hardness
Water hardness is a measure of dissolved divalent cations (positively charged ions with a valence state of +2) in water, including calcium, magnesium, strontium, aluminum, and iron. The term “hardness” was originally developed to describe the relative difficulty of creating a lather with soap using water containing dissolved minerals, causing undesirable chemical interference. To a lesser degree, monovalent cations (+1 charge), such as sodium and potassium, can create similar “pseudo- hardness” effects. Many of these cations are found naturally in groundwater in certain parts of Virginia, particularly in the Valley and Ridge region and parts of the Coastal Plain. Water is a great solvent, so as groundwater moves, it dissolves minerals or sediment it comes in contact with (Pieper et al. 2016). Groundwater tends to be “hard,” or high in mineral content, in the Valley and Ridge region, and “soft,” or low in hardness, in the Appalachian Plateau, Blue Ridge and Piedmont areas of Virginia.
Most test kits measure “total hardness” by detecting the levels of dissolved calcium and magnesium, which are the primary cations contributing to hardness in natural waters. Calcium and magnesium can cause weak-acid pesticides to deactivate upon binding, diluting the spray mixture and resulting in reduced solubility. Calcium contributes to the formation of mineral scale (hard mineral deposit), which can build up in sprayers over time. At excess levels, other common cations, such as aluminum, iron, manganese, and strontium, can cause blockages in spray equipment, affect crop development, and cause pesticides to fall out of solution, reducing their efficacy.
Hardness is expressed in units of equivalent calcium carbonate (CaCO3) as parts per million (ppm), which is equivalent to milligrams per liter of water, or in grains per gallon (gpg), where 1 grain is equal to 17.1 mg/L hardness. Water that is above 120 ppm (table 1) is considered “hard” and can cause problems for spray water, so treatment should be considered. The level of hardness that affects spray water depends on the pesticide and application rate. For example, a hardness of 500 ppm can completely deactivate 2,4-D. Depending on application rate, the efficacy of glyphosate may be affected if hardness is over 350 ppm or 20 gpg.
| Water classification | CaCO3 Equivalent (mg/L) |
|---|---|
| Soft | < 75 |
| Moderately hard | 75-150 |
| Hard | 150-300 |
| Very hard | > 300 |
If the water used for mixing is hard, it may be necessary to add ammonium sulfate (AMS) to increase pesticide efficacy, especially with weak-acid, salt-based pesticides, which are the most vulnerable to the effects of water hardness. Ammonium sulfate is most useful when supplied as a formulated liquid or in a soluble crystalline form. It has been shown to be the most effective when used in water with elevated calcium levels. Pesticide labels sometimes have recommendations on how much ammonium sulfate to add depending on water test results, but the amount can also be calculated manually. This equation has been developed by North Dakota State University (Chahal et al. 2012) to calculate the amount of ammonium sulfate in pounds needed for 100 gallons of water:
AMS (lbs./100 gallons) = (0.042 x ppm of iron) + (0.014 x ppm of magnesium) + (0.009 x ppm of calcium) + (0.005 x ppm of sodium) + (0.002 x ppm of potassium)
With information on the levels of ions in water, add the calculated amount of ammonium sulfate or read the label and apply the recommended amount.
Another way to alleviate hard water issues is by using ammonium sulfate replacements. Using softening agents and using water that is not too hot or cold can also help reduce the negative impact of hard water (McDougall 2012).
Turbidity/Total Suspended Solids (TSS)
Turbidity is a relative measurement of water clarity. Total suspended solids are a specific measurement of the grains of silt, sand, clay, and organic matter that are larger than 0.2 microns found in water. (For comparison, a human hair is about 50 microns.) These solid particles remain in suspension in the water, which causes the water to be turbid (fig. 2). Particulates can clog or block screens and nozzles, which can lead to uneven sprays. Using turbid water can reduce efficacy of certain pesticides (e.g., glyphosate or paraquat) because the pesticide binds to the particles in the water (McDougall 2012).
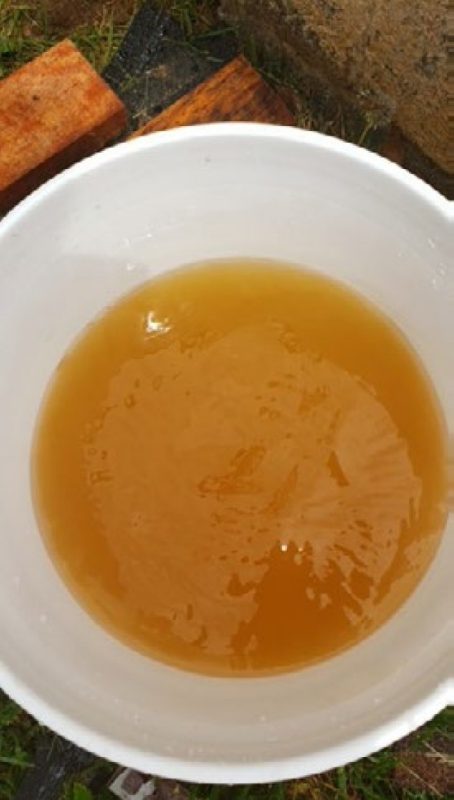
To measure turbidity, a bucket test can be performed by dropping a quarter to the bottom of a 5-gallon bucket filled with water. If the quarter cannot be seen in the bottom of the bucket, the water is too turbid to use. To help reduce turbidity, filter the water or use settling agents such alum.
Key Characteristics of Pesticides to Consider
Certain pesticide characteristics can determine how the pesticide interacts with water, target pests or weeds, and the environment. Adsorption refers to the tendency of the pesticide to bind to soil particles; it can result in pesticide inactivation. Persistence is the ability of the pesticide to remain active in its original state for an extended period of time before degrading and is described in terms of half-life, which can be affected by the pH of mix water and storage time (Fishel 2020).
Adsorption: Suspended Solids and Kd/Koc
Kd (distribution coefficient) and Koc (sorption coefficient) are pesticide characteristics that are used to describe the environmental fate and behavior of pesticides (Wauchope et al. 2002). Together, they measure the tendency of a chemical to adsorb (bind) suspended particles in water (Whitford et al. 2009) and the mobility of the pesticide in the soil. The distribution coefficient is measured in the lab as Kd and is defined as the ratio of a chemical substance (e.g., pesticide) adsorbed onto soil per volume of water (Kerle, Jenkins, and Vogue 2007). Kd values can vary because the organic carbon content of the soil is not considered in the equation. To make up for this, Kd is used to obtain Koc, the sorption coefficient: Koc = (Kd * 100)/ % organic carbon (ChemSafetyPro 2016).
Adsorption usually occurs by distribution into the soil organic matter, which is why Koc is used to compare the relative sorption of pesticides (Kerle, Jenkins, and Vogue 2007). Pesticides with high Kd and Koc values (greater than 1,000 mL/g) bind tightly to sediment and organic matter if present in spray water, resulting in less active ingredient available (Whitford et al. 2009). The higher the Koc value, the more strongly the pesticide is sorbed and the less mobile it is (Kerle, Jenkins, and Vogue 2007). Pesticides with a high Koc (e.g., glyphosate, Paraquat, Diquat) are vulnerable to inactivation after binding to suspended soil particles in the spray tank if water is turbid (Tharp and Whitford 2015). Pesticides with low Koc values (less than 300-500 mL/g), such as 2,4-D, Dicamba and Acephate, have a lower potential to adsorb and bind to suspended particles and are more mobile and easily transported onto the target plant or pest (Gillespie, Czapar, and Hager 2011). If water is noticeably turbid, consider filtration of the water, find another water source, or select pesticides with a low Kd/ Koc.
Half-life
A pesticide’s half-life is the amount of time it takes for a given quantity of pesticide to be reduced by half. When the pesticide begins to break down, performance will decrease. The longer a pesticide’s half-life, the more persistent the pesticide (Fishel 2020). Pesticides with short half-lives can be problematic and require more frequent sprays, costing time and money. The pH of the mix water and storage time can affect half-life of a pesticide.
Mixing pesticides in extreme water pH can affect both stability and half-life (table 2). For example, when dimethoate is mixed in water with a pH of 9, it has a half-life of 48 minutes. That means in 48 minutes after mixing the product, 50% of the active ingredient would be lost. If the same product is mixed with water that has an acidic pH of 6, it would have a half-life of 12 hours. Water pH can impact pesticide efficacy.
| Pesticide Common name |
Pesticide Trade name |
pH 5 | pH 6 | pH 7 | pH 8 | pH 9 |
|---|---|---|---|---|---|---|
| acephate | Orthene | 40 days | N/A | 46 days | N/A | 16 days |
| carbaryl | Sevin | N/A | 125 days | 24 days | 2.5 days | 1 day |
| diazinon | Knox-out | 31 days | N/A | 185 days | N/A | 136 days |
| dimethoate | Cygon | N/A | 12 hours | N/A | N/A | 48 minutes |
| malathion | Digon | N/A | 8 days | 3 days | 19 hours | N/A |
Storage time, or the amount of time a mixture is left in the tank, can also impact the efficacy of certain pesticides. The likelihood of a pesticide degrading in the spray tank depends on water pH. Most pesticides are weakly acidic and perform best at a pH between 4-6.5 for short-term (12-24 hours) storage of most mixtures in the spray tank. A pH between 6-7 is suitable for immediate spraying for many pesticides, but many will begin to degrade after just 1-2 hours’ storage time. A water conditioner or acidifier should be used in the spray mix if the water is alkaline (pH greater than 7). The effect of pH usually proceeds faster as the temperature of water increases (Whitford et al. 2009).
Conclusion
Water is the most common carrier used to apply pesticides. Pesticide applicators draw water from a variety of sources that can differ in chemistry depending on many factors. Water interacts with pesticide products to form a spray mixture or solution. Properties of water including pH, dissolved solids, and hardness can impact pesticide performance. Characteristics of pesticides including Kd, Koc and half-life can determine how a particular pesticide will interact with spray water. Understanding and managing water quality can improve pesticide efficacy. Applicators should test all spray water sources to determine if they are acceptable for the products they plan to use. Always read and follow pesticide label instructions to provide the best results possible.
References
Chahal, G., J. Roskamp, T. Legleiter, and B. Johnson. 2012. “The Influence of Spray Water Quality on Herbicide Efficacy.” Purdue Weed Science, Purdue University, West Lafayette, IN. https://ag.purdue.edu/btny/purdueweedscience/extension/water_quality/.
ChemSafetyPro. 2016. Soil Adsorption Coefficient (KD/ KF/KOC/KFOC) web page. https://chemsafetypro.com/Topics/CRA/Soil_Adsorption_Coefficient_ Kd_Koc.html.
Cornell Cooperative Extension. 2013. “How Copper Sprays Work and Avoiding Phytotoxicity.” Cornell University, Ithaca, NY. https://cvp.cce.cornell.edu/submission.php?id=140.
Fishel, F. 2020. “Pesticide Characteristics.” Publication PI-166. University of Florida Institute of Food and Agricultural Sciences Extension, Gainesville. https://edis.ifas.ufl.edu/publication/PI202.
Gillespie, W., G. Czapar, and A. Hager. 2011. “Pesticide Fate in the Environment: A Guide for Field Inspectors.” Illinois State Water Survey, University of Illinois at Urbana-Champaign.
Kerle, E., J. Jenkins, and P. Vogue. 2007 “Understanding Pesticide Persistence and Mobility for Groundwater and Surface Water Protection.” Publication EM8561-E. Oregon State University Extension Service. PDF downloaded at https://ir.library.oregonstate.edu/downloads/8s45q9127.
McDougall, S. 2012. “Water Quality for Chemical Spraying.” NSW Department of Primary Industries, New South Wales, Australia. https://www.dpi.nsw.gov.au/agriculture/horticulture/vegetables/translated-resources/water-chemical.
McGrath, M. 2022. “Minimizing Injury from Copper Fungicides”. Cornell University https://www.vegetables.cornell.edu/files/2022/08/Copper-Fungicides-Minimizing-Injury_McGrath-2022.pdf
McKie, P. and W. Johnson. 2014. “Water pH and its Effect on Pesticide Stability.” University of Nevada Cooperative Extension, Reno. https://www.yumpu.com/en/document/view/22811481/water-ph-and-its-effect-on-pesticide-stability.
Pieper, K., L. Krometis, B. Benham, and D. Gallagher. 2016. “Simultaneous Influence of Geology and System Design on Drinking Water Quality in Private Systems.” Journal of Environmental Health 79 (2), E1-E9.
Tharp, C. 2017. “Pesticide Performance and Water Quality.” Montana State University Extension, East Lansing. PDF downloaded at https://apps.msuextension.org/montguide/guide.html?sku=MT201305AG.
Tharp, C., and F. Whitford. 2015. “Does Water Quality Make a Difference in the Performance of a Pesticide?” University of Idaho Extension, Moscow, and Idaho State Department of Agriculture Pesticide Safety Education Program, Boise. PDF downloaded at https://bit.ly/waterqualpesticide.
Wauchope, R., S. Yeh, J. Linders, R. Kloskowski, K. Tanaka, B. Rubin, and A. Katayama. 2002. “Pesticide Soil Sorption Parameters: Theory Measurement, Uses, Limitations, and Reliability.” Pest Management Science 58 (2002): 419-445. DOI: 10.1002/ps.489.
Whitford, F., D. Penner, B. Johnson, L. Bledsoe, N. Wagoner, J. Garr, K. Wise, J. Obermeyer, and A. Blessing. 2009. “The Impact of Water Quality on Pesticide Performance.” Publication PPP-86. Purdue University Extension, West Lafayette, IN. PDF downloaded at https://mtsenvironmental.ca/wp-content/uploads/2021/10/ppp-86.pdf.
Acknowledgments
The authors would like to acknowledge the following individuals who assisted with writing and editing this publication and the development of the Virginia Tech Spray Water Assessment Program: Brian Benham, Professor and Extension Specialist, Virginia Tech Department of Biological Systems Engineering; Kelly Peeler, Water Quality Lab Manager, Virginia Tech Department of Biological Systems Engineering; Jeffrey Parks, Virginia Tech Department of Civil and Environmental Engineering; Michael Heatwole, Virginia Water Well Association and WaterRight. Thank you to the following Virginia Cooperative Extension agents, who were instrumental in creating the Virginia Tech Spray Water Assessment Program: Mark Sutphin, Timothy Ohlwiler, Ashley Edwards, Ashley Appling, Beth Sastre-Flores, Laura Maxey Nay, Ed Olson, Scott Reiter, Stephanie Romelczyk, and Jason Cooper.
Virginia Cooperative Extension materials are available for public use, reprint, or citation without further permission, provided the use includes credit to the author and to Virginia Cooperative Extension, Virginia Tech, and Virginia State University.
Virginia Cooperative Extension is a partnership of Virginia Tech, Virginia State University, the U.S. Department of Agriculture, and local governments. Its programs and employment are open to all, regardless of age, color, disability, sex (including pregnancy), gender, gender identity, gender expression, genetic information, ethnicity or national origin, political affiliation, race, religion, sexual orientation, or military status, or any other basis protected by law.
Publication Date
February 22, 2024