Native warm season grass variety trial, 2021-2023
ID
SPES-562NP

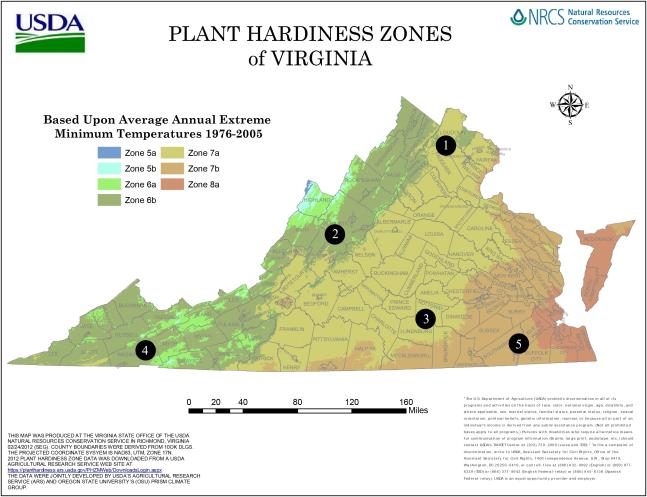
Figure 1: County and hardiness zone map of Virginia showing locations of native warm season grass variety trial. The numbers correspond to the location list in the text. Map accessed from https://efotg.sc.egov.usda.gov/references/public/va/Pl antHardiness.pdf.
Establishment
A mixture of glyphosate (41%) at 2 qt/ac and 0.5% nonionic surfactant was sprayed on plot areas the fall prior to seeding, except for the Middleburg location which was sprayed one week prior to seedbed preparation. Seedbeds were prepared for planting through discing following by harrowing or rototillage. The plots were then rested for a minimum of one week to allow the soil to settle, with the exception of the Raphine location which was cultipacked immediately following tillage.
Plot sizes were six by ten feet with four replications per cultivar. A Carter forage plot seeder was used to seed all of the species except the eastern gamagrass, which was planted with a single row push corn planter in four strips per plot due to the large seed size of this species. Seeding depth was less than ¼” of an inch for all of the species except the eastern gamagrass, which was planted at ¾-1” depth. All cultivars were planted on a pure live and non- dormant seed basis with 9 lb/ac for the big bluestem, 14 lb/ac for the eastern gamagrass, 9 lb/ac for the indiangrass, and 6 lb/ac for the switchgrass. A fixed amount of pelletized lime was used as a carrier for all of the species and varieties.
All plots were sprayed again with a mixture of glyphosate (41%) at 2 qt/ac and 0.5% nonionic surfactant at planting.
Plots were established on the following dates:
May 27, 2020: Blackstone
June 2, 2020: Glade Spring
June 11, 2020: Raphine
June 24, 2020: Suffolk
July 14, 2020: Middleburg
Rainfall from May through July at each location was within 1.5” of the 30-year precipitation mean for those three months. Approximately two months following planting, plots at all locations except for Blackstone were clipped with a rotary mower to remove weed biomass above the native grass seedlings. The mower was set to a height at or above the tallest height of the native grasses.
Germination Evaluation and Statistical Analysis
Seedling germination was evaluated around sixty days following establishment at Raphine and
Blackstone. A 0.5 m2 quadrat was placed directly in the center of each plot, and the number of native grass seedlings was counted within the quadrat.
Seedling count by cultivar was compared within a species using PROC MIXED in SAS Studio, v. 9.4 (SAS Inst., Cary, NC). Differences were considered significant when P ≤ 0.05 and as trends when 0.05 < P ≤ 0.10.
Harvest Management and Statistical Analysis
Plots were harvested once in 2021 at Raphine, Blackstone, and Suffolk. Plots were harvested twice in 2022 at those three locations and once at Middleburg. Plots were harvested once in 2023 at Middleburg and Glade Spring and twice at Raphine, Blackstone, and Suffolk. No fertilizer or soil amendments were applied to the plot area at any location for the duration of this test. After each harvest, all biomass was removed from the plots. The monthly precipitation for the county where each trial was located is presented in Appendix 6.
Cutting height was set to 5” for all plots at harvest. Total biomass harvested from the plot area was recorded, and a subsample was collected for dry matter corrections. The subsamples were dried in a forced oven at 135 °F for a minimum of four days before weighing. The dry matter correction was applied to the total fresh plot weight to calculate dry matter yield per unit area.
Prior to harvest, percent cover of the cultivar and the weed pressure by type of weed (grass, broadleaf, and sedge) was scored in each plot using a modified Daubenmire ranking scale (1: 0-5.0% cover; 2: 5.1-
25.0% cover; 3: 25.1-50.0% cover; 4: 50.1-75.0%
cover; 5: 75.1-95.0% cover; 6: 95.1-100.0% cover).
Plots were sprayed with 3 qt/ac pendimethalin (38.7%), 1 qt/ac glyphosate (41%) or 1 qt/ac triclopyr
(60.5%), and 0.5% non-ionic surfactant in April 2022 to reduce weed competition at all locations.
Forage dry matter yield by cultivar was compared within a species using PROC MIXED in SAS Studio,
v. 9.4 (SAS Inst., Cary, NC). Locations were analyzed separately for the tables presented in the appendices. Differences were considered significant when P ≤ 0.05 and as trends when 0.05 < P ≤ 0.10.
Results
Germination
Seedling count by cultivar is shown in Table 1. There tended to be a treatment (cultivar) by location interaction (P=0.0642). Some cultivars had lower germination than others, but by the second year, these differences had an indistinguishable effect on yield, likely due to germination of dormant seed and tillering of seedlings in the first year.
Species | Cultivar | LSM1 | SE2 |
BB | Niagara | 9.00 | 1.57 |
BB | KY Ecotype* | 1.00 | 1.57 |
BB | Kaw | 5.92 | 1.57 |
BB | Pawnee | 6.33 | 1.57 |
EG | Highlander* | 1.42 | 0.65 |
EG | Iuka IV | 4.67 | 0.65 |
EG | Pete | 3.58 | 0.65 |
IG | Cheyenne | 6.17 | 1.88 |
IG | NC Ecotype | 6.17 | 1.88 |
IG | Rumsey | 7.00 | 1.88 |
IG | KY Ecotype | 9.33 | 1.88 |
IG | Osage | 8.67 | 1.88 |
IG | GA Ecotype* | 0.75 | 1.88 |
IG | Holt | 9.25 | 1.88 |
SG | Shawnee* | 5.67 | 3.93 |
SG | Cave-in-Rock* | 6.33 | 3.93 |
SG | Performer | 11.17 | 3.93 |
Table 1: Seedling count by cultivar at Raphine and Blackstone locations 60 days following planting (BB: big bluestem; EG: eastern gamagrass; IG: indiangrass; SG: switchgrass)
SG | BoMaster | 10.25 | 3.93 |
SG | Alamo | 19.67 | 3.93 |
SG | Carthage** | 9.08 | 3.93 |
1 Least significant means
2 Standard error
*significantly different from the highest numerical value within the same species based on 0.05 LSD
**tended to be significantly different from the highest numerical value within the same species based on 0.10 LSD
Yield
Seasonal yields (sum of all of the harvests at a location each year) were analyzed within a species across all five locations. There was no treatment (cultivar) by location interaction for any of the species (P>0.05). However, there tended to be treatment by location interaction for indiangrass (P=0.0964).
Mean seasonal yields for each cultivar are presented as averages across all locations in Table 2. There were no significant differences in yields of cultivars within a species. However, cultivar tended to have a significant effect in the comparison of indiangrass due to the poor germination and growth of two cultivars, ‘NC ecotype’ and ‘KY ecotype.’ For these two cultivars, some of the plots were not harvested due to absence of the cultivar of interest.
Table 2: Seasonal yield (lb/acre) by cultivar across five locations in Virginia and over three seasons (BB: big bluestem; EG: eastern gamagrass; IG: indiangrass; SG: switchgrass; Non-est: non- estimable)
Species | Cultivar | LSM1 | SE2 |
BB | Niagara | 4,837 | 1,511 |
BB | KY Ecotype | 5,012 | 1,516 |
BB | Kaw | 4,318 | 1,502 |
BB | Pawnee | 4,094 | 1,523 |
EG | Highlander | 6,872 | 2,459 |
EG | Iuka IV | 6,150 | 2,463 |
EG | Pete | 6,736 | 2,461 |
IG | Cheyenne | 4,728 | 1,162 |
IG | NC Ecotype* | Non-est | . |
IG | Rumsey | 4,664 | 1,170 |
IG | KY Ecotype | 4,880 | 1,168 |
IG | Osage | 4,515 | 1,180 |
IG | GA Ecotype* | Non-est | . |
IG | Holt | 3,534 | 1,226 |
SG | Shawnee | 7,421 | 2,562 |
SG | Cave-in-Rock | 7,585 | 2,564 |
SG | Performer | 6,775 | 2,573 |
SG | BoMaster | 7,853 | 2,562 |
SG | Alamo | 7,700 | 2,568 |
SG | Carthage | 7,348 | 2,562 |
evaluating the results for these species at these locations.
1 Least significant means
2 Standard error
*tended to be significantly different from the highest numerical value within the same species based on 0.10 LSD
Although differences were not analyzed across species, it may be useful to note the greater yields of switchgrass and eastern gamagrass compared to big bluestem and indiangrass. While the two former species do in general produce more biomass than the two latter species, the yield data presented here are likely biased towards switchgrass and eastern gamagrass because they are earlier maturing species. Due to all species and plots within a location harvested on a single date once or twice a year, the earlier maturing species would indicate greater yields than the later maturing species. Farmers considering certain species for selection should consider nutritive value and palatability, however, not just forage yield.
Seasonal yields are also presented by year for each location in Appendices 7-11. Plots with insufficient cover of the target cultivar for a reliable estimation of yield within the plot were not harvested. Poor establishment of some species at some locations (e.g. indiangrass at Middleburg) resulted in very high standard errors. Thus, caution should be taken when
Germination and eventual productivity of indiangrass ecotypes (‘GA ecotype’ and ‘NC ecotype) were lower than for the other cultivars and ecotypes at four of the locations. This was a common pattern across all locations with the exception of Glade Spring, where indiangrass productivity was poor across cultivars and ecotypes due to poor establishment at this site.
Ecotypes are defined as seeds from an unimproved selection of seed from a given area. These varieties are thought to be better adapted to the region from which they were selected due to their extended period of evolution in that region. Cultivars, however, are improved lines of plants developed through selective breeding processes to target specific desired characteristics. These characteristics may include growth, forage nutritive value, and diseases resistance. As a result, improved cultivars often, but not always, may be expected to be higher yielding than ecotypes.
Conclusions
While this project yielded a substantial amount of information on the productivity of various cultivars and ecotypes of NWSG across Virginia, it also reinforced a few points that anyone interested in getting these species established for forage production or wildlife habitat may find helpful.
Germination of these perennial species can be slow, especially compared to the growth of nonnative annual weeds. Weed control through advanced site preparation and follow-up herbicide or mechanical control is imperative for the success of the planting. In addition, full productivity of these species may not be realized until two seasons following establishment.
Once these species are established, they can be very productive, even without fertilizer or lime applications. In the case of this variety trial, no soil amendments were applied to the plots despite the removal of biomass from the plots following each harvest. In a grazing system, these nutrients would be largely recycled through the grazing animals and thus very little soil amendments would be necessary for the optimum productivity of these species. In a hay production system where the vegetation is removed from the field year after year, it would be
advantageous to follow soil test nutrient recommendations when applying fertilizer and lime.
In general, the cultivars matured in the following order: eastern gamagrass, switchgrass, big bluestem, and indiangrass. This may be helpful information when selecting a species based on when forage is most needed and to prevent growing season overlap with the rest of the forage system. It is also not recommended to mix eastern gamagrass or switchgrass with plantings of the other species due to their more rapid rates of maturity. If a mixture of species is desired for forage production purposes, it is helpful to pair species and cultivars together with similar maturity rates so that harvest can be more appropriately timed to the needs of the crop.
Greater biomass yields may be useful in some contexts (maximizing yield for forage and biomass production purposes), but in some situations, such as in wildlife or conservation plantings, too much biomass may not be advantageous. In wildlife habitat plantings, a thinner grass sward may be more beneficial to small birds and mammals building nests and burrows within the stand. In these situations, ecotypes may be a better choice.
Acknowledgements
Seed for this trial was donated by Ernst Conservation Seeds, Gamagrass Seed Company, Garrett Wildflower Seed Farm, Roundstone Native Seed, and Star Seed, Inc.
This trial was made possible by the research farms and crews at each location and with the support of the Virginia Agricultural Experiment Station. A Conservation Innovation Grant from the United States Department of Agriculture Natural Resources Conservation Service provided funding for this work.
Visit Virginia Cooperative Extension: ext.vt.edu
Virginia Cooperative Extension is a partnership of Virginia Tech, Virginia State University, the U.S. Department of Agriculture, and local governments. Its programs and employment are open to all, regardless of age, color, disability, sex (including pregnancy), gender, gender identity, gender expression, national origin, political affiliation, race, religion, sexual orientation, genetic information, military status, or any other basis protected by law.
2023 SPES-562NP
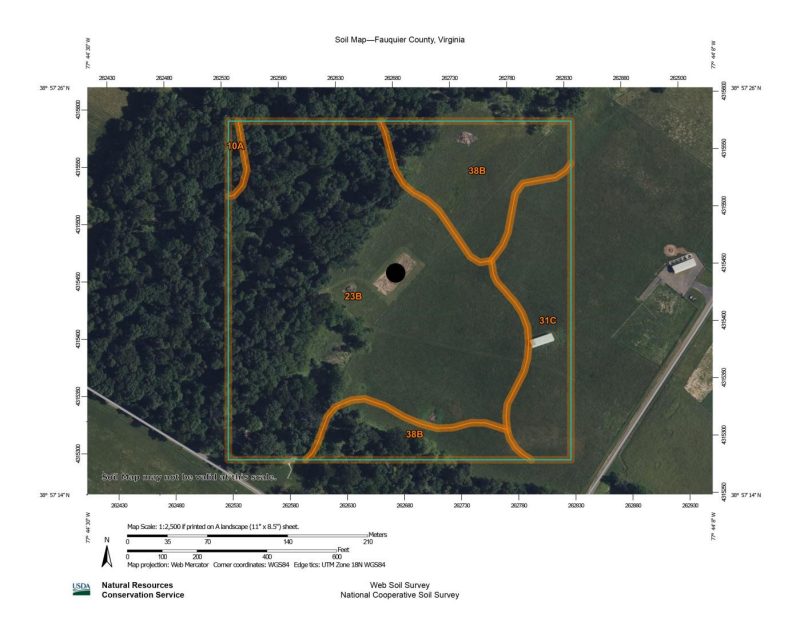
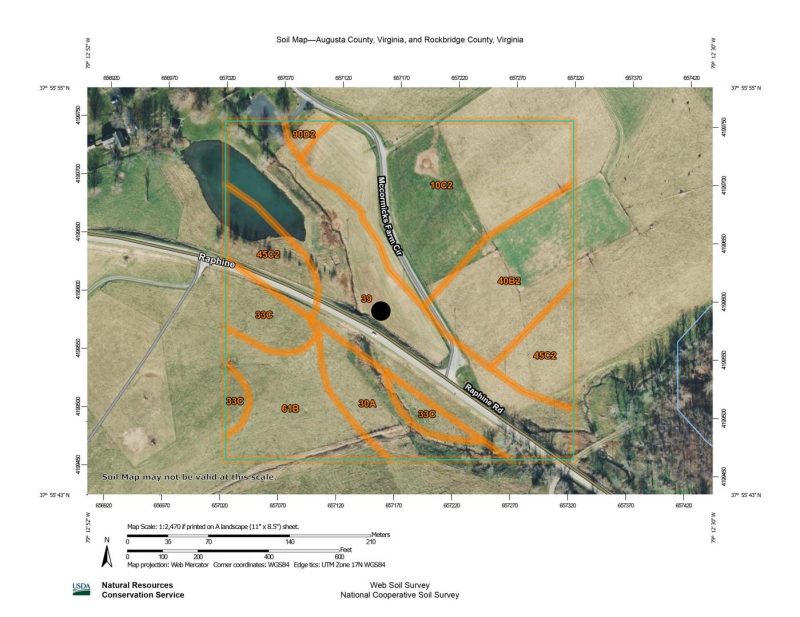
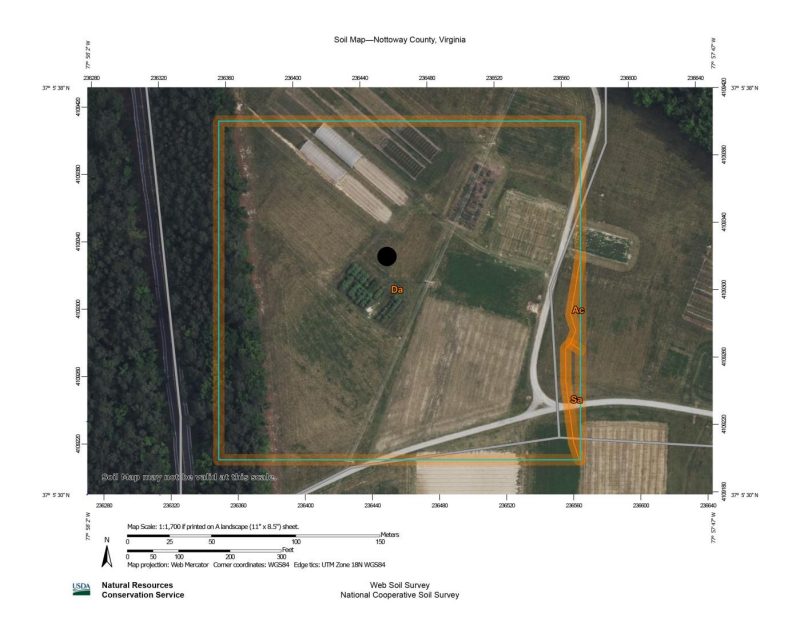
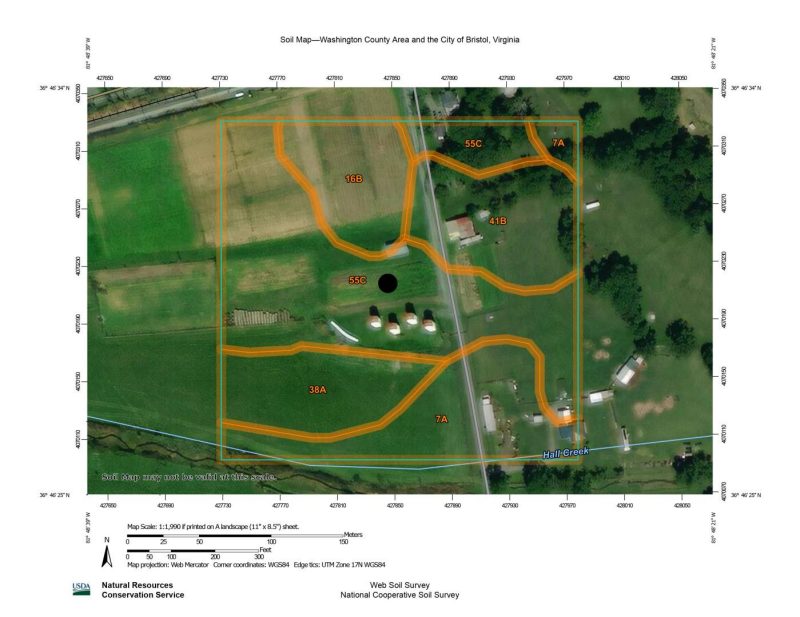
Appendix 1: Soil map at the Middleburg AREC in Middleburg, Virginia with the location of the variety trial denoted with a black circle. The soil type this plot is planted on is a Purcellville silty clay loam, which is a deep, well-drained soil with high available soil moisture potential. The top two soil horizons have a silty clay loam texture down to approximately 20 inches and the next two horizons are a silt loam down to 64 inches. This is considered prime farmland with a land capability class 2e. A soil test from the site of the variety trial indicated 55 ppm phosphorus, 411 ppm potassium, 215 ppm magnesium, 1442 ppm calcium, 6.9% organic matter, and a pH of 6.3.

Appendix 2: Soil map at the Shenandoah Valley AREC in Raphine, Virginia with the location of the variety trial denoted with a black circle. The variety trial was planted on a Fluvaquent which is a mixed alluvial soil in the floodplain of this field. The soil is deep, naturally poorly drained and has a high water table near the soil surface over the winter months. The soil texture from the surface down to 9 inches is typically a fine sandy loam, from 9 – 33 inches is a sandy loam and from 33 – 67 inches is a sandy clay loam. This soil has a land capability class of 4w and meets hydric criteria. A soil test from the site of the variety trial indicated 22 ppm phosphorus, 60 ppm potassium, 195 ppm magnesium, 1574 ppm calcium, 6.4% organic matter, and a pH of 5.7.

Appendix 3: Soil map at the Southern Piedmont AREC in Blackstone, Virginia with the location of the variety trial denoted with a black circle. The variety trial was planted on a Durham coarse sandy loam. This soil is considered deep and well-drained with a moderate available water capacity. The soil texture from the surface down to 18 inches is a coarse sandy loam, then changes to a sandy clay loam down to 78 inches. The soil has a land capability class rating of 2e. A soil test from the site of the variety trial indicated 32 ppm phosphorus, 72 ppm potassium, 118 ppm magnesium, 506 ppm calcium, 2.6% organic matter, and a pH of 5.5.

Appendix 4: Soil map at the Southwest AREC in Glade Spring, Virginia with the location of the variety trial denoted with a black circle. The variety trial was planted on a Wyrick/Marbie silt loam complex. The Wyrick component is a deep, well-drained soil with high available water capacity with good production potential and a land capability classification of 2e. The typical Wyrick soil has a silt loam textured surface horizon down to 12 inches, and a silty clay loam down to 25 inches, and a silty clay down to 65 inches. The Marbie component has a root restrictive layer (fragipan) ranging between 18 and 36 inches resulting in a low available water capacity in this soil component. The typical Marbie has a soil textural class of silt loam from the surface down to 41 inches, and a silty clay loam from 41
– 65 inches. A soil test from the site of the variety trial indicated 199 ppm phosphorus, 239 ppm potassium, 153 ppm magnesium, 1094 ppm calcium, 3.5% organic matter, and a pH of 5.8.

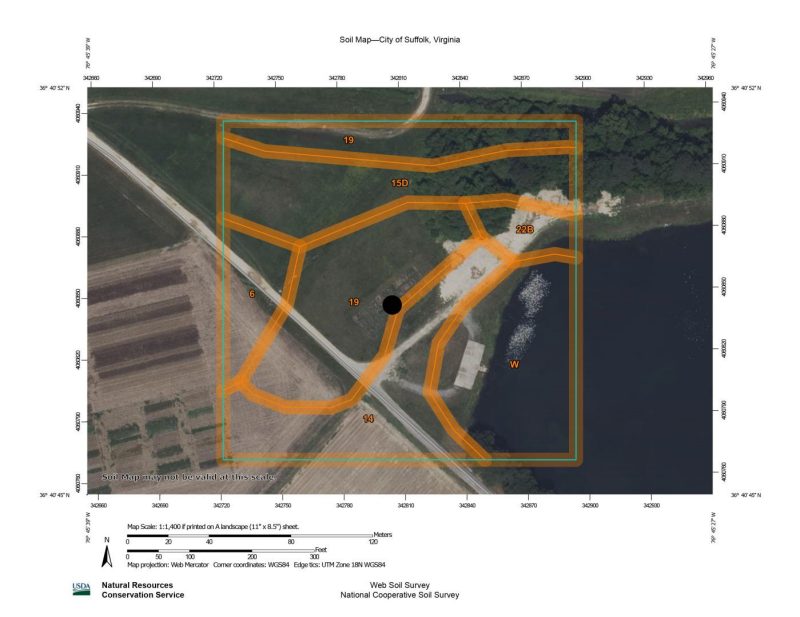
Appendix 5: Soil map at the Tidewater AREC in Suffolk, Virginia with the location of the variety trial denoted with a black circle. The variety trial was planted across a field that had both a Rains fine sandy loam (19) and a Lynchburg fine sandy loam (14) soil. Both the Rains and Lynchburg soils are deep and poorly drained with a moderate available water holding capacity and a high, water table between 6 and 12 inches from the soil surface during the winter months. Both soils meet hydric criteria. The typical Rains soil has a fine sandy loam surface horizon in the top 6 inches above a sandy clay loam from 6 – 65 inches deep. The typical Lynchburg soil has a surface horizon of a loamy sand for the top 11 inches, above a sandy clay loam down to 47 inches above a sandy loam down to 65 inches. A soil test from the site of the variety trial indicated 31 ppm phosphorus, 45 ppm potassium, 109 ppm magnesium, 861 ppm calcium, 4.4% organic matter, and a pH of 5.2.

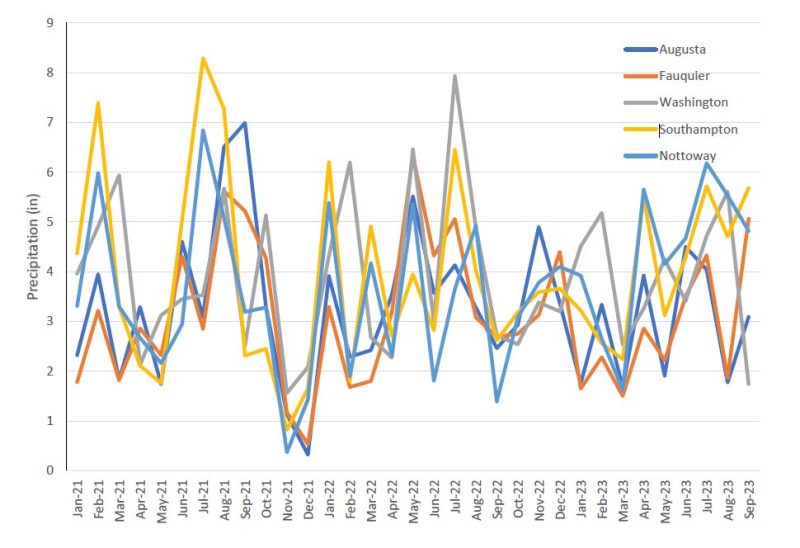
Appendix 6: Monthly precipitation by county for each variety trial location from January 2021 through September 2023. Data accessed from National Oceanic and Atmospheric Administration’s National Center for Environmental Information County Time Series (https://www.ncei.noaa.gov/access/monitoring/climate-at-a-glance/county/time- series/).

Augusta
Fauquier Washington Southampton Nottoway
9
8
7
6
Precipitation (in)
5
4
3
2
1
Jan-21
Feb-21 Mar-21 Apr-21 May-21 Jun-21 Jul-21 Aug-21 Sep-21 Oct-21 Nov-21 Dec-21 Jan-22 Feb-22 Mar-22 Apr-22 May-22 Jun-22 Jul-22 Aug-22 Sep-22 Oct-22 Nov-22 Dec-22 Jan-23 Feb-23 Mar-23 Apr-23 May-23 Jun-23 Jul-23 Aug-23 Sep-23
0
Appendix 7: Seasonal yield (lb/acre) by cultivar at the Middleburg AREC in Middleburg, Virginia over three seasons. Maturity rankings were collected at the first harvest of each year, and the maturity ranking was reported with the greatest number of plots recorded at that ranking. Plots at this location were harvested once in 2022 (August 17) and twice in 2023 (July 5 and September 15).
Species1 |
Cultivar | 2022 | 2023 | ||||
LSM2 | SE3 | Maturity4 | LSM2 | SE3 | Maturity4 | ||
BB | Niagara | 3,684 | 873 | R3 | 5,232 | 1,200 | R3 |
BB | KY Ecotype | 5,084 | 1,233 | R2 | 3,639 | 1,200 | E |
BB | Kaw | 5,261 | 725 | R3 | 4,125 | 871 | R1 |
BB | Pawnee | 5,250 | 873 | R3 | 4,051 | 1,220 | R1 |
EG | Highlander | 5,887 | 1,035 | S | 6,652* | 1,035 | S |
EG | Iuka IV | 5,768 | 1,195 | S | 11,554 | 1,464 | S |
EG | Pete | 5,558 | 1,035 | S | 6,048* | 1,464 | S |
IG | Cheyenne | 6,417 | 5,041 | S | 5,373 | 5,041 | E |
IG | NC Ecotype5 | . | . | E | . | . | E |
IG | Rumsey | 5,288 | 5,041 | R1 | 5,332 | 5,041 | E |
IG | KY Ecotype | 5,369 | 5,029 | E | . | . | E |
IG | Osage | 4,317 | 5,833 | E | 3,508 | 5,833 | E |
IG | GA Ecotype5 | . | . | E | . | . | V |
IG | Holt | 4,789 | 7,570 | S | . | . | R1 |
SG | Shawnee | 4,653 | 1,548 | S | 8,257 | 1,726 | R1 |
SG | Cave-in-Rock | 4,757 | 1,729 | S | 8,540 | 1,730 | R1 |
SG | Performer | 8,739 | 2,144 | S | 6,166 | 2,144 | E |
SG | BoMaster | 7,212 | 1,725 | S | 9,874 | 1,548 | E |
SG | Alamo | 6,754 | 2,070 | R2 | 10,096 | 1,768 | E |
SG | Carthage | 6,565 | 1,725 | S | 6,526 | 1,548 | R1 |
1 Species: BB = big bluestem, EG = eastern gamagrass, IG = indiangrass, SG = switchgrass
2 Least significant means
3 Standard error
4 Maturity ranking: V = vegetative, E = elongating, R1 = boot stage, R2 = fully emerged, R3 = anthesis, S = mature seed
5 Insufficient data to report
* Yield was significantly different from the highest numerical value within the same species based on 0.05 LSD
Appendix 8: Seasonal yield (lb/acre) by cultivar at the Shenandoah Valley AREC in Raphine, Virginia over three seasons. Maturity rankings were collected at the first harvest of each year, and the maturity ranking was reported with the greatest number of plots recorded at that ranking. Plots at this location were harvested once in 2021 (November 5), twice in 2022 (June 29 and August 31), and twice in 2023 (July 11 and September 6).
Species1 |
Cultivar | 2021 | 2022 | 2023 | |||||
LSM2 | SE3 | LSM2 | SE3 | Maturity4 | LSM2 | SE3 | Maturity4 | ||
BB | Niagara | 968 | 467 | 7,006 | 528 | V | 4,154 | 528 | R2 |
BB | KY Ecotype | 522 | 467 | 7,001 | 467 | V | 4,886 | 467 | V |
BB | Kaw | 454 | 467 | 8,068 | 467 | V | 5,568 | 467 | E |
BB | Pawnee | 871 | 467 | 6,403 | 528 | V | 5,621 | 852 | V |
EG | Highlander | 1,352 | 1,416 | 11,231 | 1,416 | E | 11,735 | 1,416 | S |
EG | Iuka IV | 1,854 | 1,416 | 10,356 | 1,416 | R3 | 11,785 | 1,416 | S |
EG | Pete | 1,400 | 1,416 | 12,364 | 1,416 | R3 | 13,669 | 1,416 | S |
IG | Cheyenne | 1,522 | 661 | 9,187 | 738 | V | 5,009 | 738 | V |
IG | NC Ecotype | 1,373 | 661 | 6,736* | 738 | V | 2,547* | 860 | V |
IG | Rumsey | 1,119 | 661 | 9,303 | 661 | V | 5,354 | 732 | V |
IG | KY Ecotype | 1,411 | 661 | 8,706 | 738 | V | 5,379 | 738 | V |
IG | Osage | 1,853 | 661 | 9,679 | 661 | V | 5,212 | 732 | V |
IG | GA Ecotype | 420 | 661 | 3,087* | 661 | V | 1,455* | 1,147 | V |
IG | Holt | 941 | 661 | 9,665 | 661 | V | 6,198 | 732 | V |
SG | Shawnee | 1,055 | 948 | 14,198 | 948 | E | 7,523 | 948 | R1 |
SG | Cave-in-Rock | 1,165 | 948 | 13,223** | 948 | E | 7,176 | 948 | R1 |
SG | Performer | 1,779 | 948 | 14,636 | 1,084 | E | 4,602* | 1,084 | E |
SG | BoMaster | 1,670 | 948 | 15,536 | 948 | E | 4,681* | 948 | E |
SG | Alamo | 2,553 | 948 | 13,844 | 948 | E | 3,759* | 948 | E |
SG | Carthage | 1,082 | 948 | 10,161* | 948 | E | 5,849 | 948 | R1 |
1 Species: BB = big bluestem, EG = eastern gamagrass, IG = indiangrass, SG = switchgrass
2 Least significant means
3 Standard error
4 Maturity ranking: V = vegetative, E = elongating, R1 = boot stage, R2 = fully emerged, R3 = anthesis, S = mature seed
* Yield was significantly different from the highest numerical value within the same species based on 0.05 LSD
** Yield tended to be significantly different from the highest numerical value within the same species based on 0.10 LSD
Appendix 9: Seasonal yield (lb/acre) by cultivar at the Southern Piedmont AREC in Blackstone, Virginia over three seasons. Plots at this location were harvested once in 2021 (September 16), twice in 2022 (June 14 and September 13), and twice in 2023 (June 15 and October 4).
Species1 |
Cultivar | 2021 | 2022 | 2023 | |||
LSM2 | SE3 | LSM2 | SE3 | LSM2 | SE3 | ||
BB | Niagara | 3,553 | 1,091 | 9,343 | 1,091 | 9,674 | 1,091 |
BB | KY Ecotype | 4,142 | 1,091 | 7,576 | 1,091 | 7,829 | 1,091 |
BB | Kaw | 4,305 | 1,091 | 8,341 | 1,091 | 9,290 | 1,091 |
BB | Pawnee | 4,200 | 1,091 | 6,850** | 1,091 | 10,112 | 1,091 |
EG | Highlander | 3,794 | 854 | 10,487 | 854 | 12,650 | 854 |
EG | Iuka IV | 3,787 | 854 | 9,167 | 854 | 9,738* | 854 |
EG | Pete | 4,229 | 854 | 11,220 | 854 | 11,572 | 854 |
IG | Cheyenne | 3,475 | 678 | 4,663* | 678 | 6,754** | 678 |
IG | NC Ecotype | 3,602 | 678 | 5,680* | 678 | 6,876** | 678 |
IG | Rumsey | 4,703 | 678 | 6,543 | 678 | 7,552 | 678 |
IG | KY Ecotype | 3,876 | 678 | 7,696 | 678 | 7,557 | 678 |
IG | Osage | 4,467 | 678 | 6,443 | 678 | 8,412 | 678 |
IG | GA Ecotype | 2,963* | 678 | 5,073* | 678 | 6,547* | 678 |
IG | Holt | 3,416 | 678 | 4,142* | 678 | 4,342* | 678 |
SG | Shawnee | 4,862 | 1,010 | 14,773 | 1,010 | 15,634 | 1,010 |
SG | Cave-in-Rock | 3,891** | 1,010 | 11,734* | 1,010 | 14,784 | 1,010 |
SG | Performer | 6,046 | 1,010 | 12,467 | 1,010 | 11,999* | 1,010 |
SG | BoMaster | 5,618 | 1,010 | 10,453* | 1,010 | 12,360* | 1,010 |
SG | Alamo | 6,556 | 1,010 | 12,664 | 1,010 | 14,881 | 1,010 |
SG | Carthage | 4,795 | 1,010 | 11,193* | 1,010 | 14,217 | 1,010 |
1 Species: BB = big bluestem, EG = eastern gamagrass, IG = indiangrass, SG = switchgrass
2 Least significant means
3 Standard error
* Yield was significantly different from the highest numerical value within the same species based on 0.05 LSD
** Yield tended to be significantly different from the highest numerical value within the same species based on 0.10 LSD
Appendix 10: Seasonal yield (lb/acre) by cultivar at the Southwest AREC in Glade Spring, Virginia over three seasons. Maturity rankings were collected at the first harvest of each year, and the maturity ranking was reported with the greatest number of plots recorded at that ranking. Plots at this location were harvested twice in 2023 (July 7 and September 12).
Species1 |
Cultivar | 2023 | ||
LSM2 | SE3 | Maturity4 | ||
BB | Niagara | 5,276 | 1,554 | R3 |
BB | KY Ecotype | 7,903 | 1,355 | E |
BB | Kaw | 2,619* | 1,554 | E |
BB | Pawnee | 2,653** | 1,883 | E |
EG | Highlander | 11,377 | 2,028 | R1 |
EG | Iuka IV | 8,219 | 2,028 | R3 |
EG | Pete | 10,420 | 2,028 | R3 |
IG | Cheyenne | 4,011 | 737 | E |
IG | NC Ecotype | 4,046 | 638 | V |
IG | Rumsey | 4,718 | 902 | E |
IG | KY Ecotype | 4,563 | 737 | V |
IG | Osage | 3,009 | 902 | E |
IG | GA Ecotype | 3,396 | 902 | V |
IG | Holt | 2,621 | 902 | E |
SG | Shawnee | 9,897 | 1,542 | E |
SG | Cave-in-Rock | 9,265 | 1,542 | R1 |
SG | Performer | 6,191* | 1,542 | E |
SG | BoMaster | 9,321 | 1,542 | E |
SG | Alamo | 5,969* | 1,542 | E |
SG | Carthage | 10,801 | 1,542 | E |
1 Species: BB = big bluestem, EG = eastern gamagrass, IG = indiangrass, SG = switchgrass
2 Least significant means
3 Standard error
4 Maturity ranking: V = vegetative, E = elongating, R1 = boot stage, R2 = fully emerged, R3 = anthesis, S = mature seed
* Yield was significantly different from the highest numerical value within the same species based on 0.05 LSD
** Yield tended to be significantly different from the highest numerical value within the same species based on 0.10 LSD
Appendix 11: Seasonal yield (lb/acre) by cultivar at the Tidewater AREC in Suffolk, Virginia over three seasons. Plots at this location were harvested once in 2021 (September 15), twice in 2022 (June 27 and September 7), and twice in 2023 (June 14 and September 14).
Species1 |
Cultivar | 2021 | 2022 | 2023 | |||
LSM2 | SE3 | LSM2 | SE3 | LSM2 | SE3 | ||
BB | Niagara | 3,282 | 1,274 | 4,531 | 1274 | 9,042 | 1274 |
BB | KY Ecotype | 2,436 | 1,274 | 3,745 | 1274 | 8,273 | 1274 |
BB | Kaw | 3,297 | 1,274 | 6,032 | 1274 | 5,916** | 1274 |
BB | Pawnee | 3,439 | 1,274 | 3,553 | 1274 | 5,953** | 1274 |
EG | Highlander | 2,170 | 905 | 4,199 | 905 | 4,199 | 905 |
EG | Iuka IV | 1,791 | 905 | 3,980 | 905 | 3,980** | 905 |
EG | Pete | 2,587 | 905 | 3,652 | 905 | 3,652 | 905 |
IG | Cheyenne | 3,127 | 986 | 6,923 | 986 | 8,313 | 986 |
IG | NC Ecotype | 3,128 | 986 | 2,773* | 986 | 7,953 | 986 |
IG | Rumsey | 2,861 | 986 | 2,528* | 986 | 5,122* | 986 |
IG | KY Ecotype | 3,237 | 986 | 4,194** | 986 | 7,234 | 986 |
IG | Osage | 3,638 | 986 | 4,286** | 986 | 6,622 | 986 |
IG | GA Ecotype | 2,802 | 986 | 3,066* | 986 | 3,399* | 986 |
IG | Holt | 2,632 | 986 | 2,565* | 986 | 5,739** | 986 |
SG | Shawnee | 3,814 | 1,697 | 6,254** | 1697 | 10,405* | 1697 |
SG | Cave-in-Rock | 3,785 | 1,697 | 7,732 | 1697 | 17,193 | 1697 |
SG | Performer | 4,329 | 1,697 | 8,912 | 1697 | 10,119* | 1697 |
SG | BoMaster | 5,037 | 1,697 | 9,409 | 1697 | 11,541* | 1697 |
SG | Alamo | 4,986 | 1,697 | 10,410 | 1697 | 16,895 | 1697 |
SG | Carthage | 3,986 | 1,697 | 8,579 | 1697 | 14,317 | 1697 |
1 Species: BB = big bluestem, EG = eastern gamagrass, IG = indiangrass, SG = switchgrass
2 Least significant means
3 Standard error
* Yield was significantly different from the highest numerical value within the same species based on 0.05 LSD
** Yield tended to be significantly different from the highest numerical value within the same species based on 0.10 LSD
Introduction
While introduced, cool-season grasses dominate Virginia pastures, there is growing interest in filling the traditionally slow period of forage productivity during the summer months with alternative forages.
Native warm season grasses (NWSG) can fill typical summer forage deficits. These grasses are productive and nutritious for livestock during the summer months. They are well-adapted to Virginia’s soils, pests, and climate. With deep root systems, these grasses perform well even in mild droughts, and nutrient inputs, such as fertilizer, are less critical compared to the input requirements of their nonnative counterparts. These grasses can even handle a lower pH compared to cool-season grasses.
While these grasses are highly productive in the summer, cool weather diminishes their productivity. Thus, common recommendations for Virginia are to include no more than 20-30% of the grazing system in NWSG species.
In addition to offering these production benefits, NWSG have an important role to play in wildlife conservation. The robust, upright form and open space between plants in a NWSG stand provides the type of habitat required for foraging and nesting by bobwhite quail and other ground nesting birds. These grasses shelter small mammals and birds from predators when left standing overwinter, even after heavy snow events.
Native warm season grasses can provide food for livestock and wildlife alike. Under proper management, NWSG provide highly nutritious forage and can persist in pastures indefinitely.
Unfortunately, their adoption has been minimal. Lack of familiarity, historic challenges with establishment, and misperceptions and uncertainty surrounding nutritional quality and stand management largely account for farmer reluctance to adopt NWSG in Virginia.
While new techniques and improved cultivars have led to more success in the establishment process, native grasses require slight differences in management during establishment and subsequent grazing management practices
In addition, there is little information available on various cultivars and ecotypes of native warm season grasses recommended for forage purposes. Cultivars are defined as selected, improved varieties, while ecotypes are generally defined as varieties selected from a single population, usually in a specific, undisturbed area.
Forage Variety Trial
The purpose of this variety trial was to determine the regional productivity of various NWSG cultivars or ecotypes of four different species of native grasses: big bluestem (Andropogon gerardii), eastern gamagrass (Tripsacum dactyloides), indiangrass (Sorghastrum nutans), and switchgrass (Panicum virgatum).
This trial was established in 2020 at five locations across Virginia. These locations encompass the dominant hardiness zones (Figure 1) and physiographic provinces of Virginia. Soil types and test result values for each location are reported in Appendices 1-5. The five locations of this variety trial were:
- Middleburg Agricultural Research and Extension Center, Middleburg, Virginia
- Shenandoah Valley Agricultural Research and Extension Center, Raphine, Virginia
- Southern Piedmont Agricultural Research and Extension Center, Blackstone, Virginia
- Southwest Agricultural Research and Extension Center, Glade Spring, Virginia
- Tidewater Agricultural Research and Extension Center, Suffolk, Virginia
Establshment
A mixture of glyphosate (41%) at 2 qt/ac and 0.5% nonionic surfactant was sprayed on plot areas the fall prior to seeding, except for the Middleburg location which was sprayed one week prior to seedbed preparation. Seedbeds were prepared for planting through discing following by harrowing or rototillage. The plots were then rested for a minimum of one week to allow the soil to settle, with the exception of the Raphine location which was cultipacked immediately following tillage.
Plot sizes were six by ten feet with four replications per cultivar. A Carter forage plot seeder was used to seed all of the species except the eastern gamagrass, which was planted with a single row push corn planter in four strips per plot due to the large seed size of this species. Seeding depth was less than ¼” of an inch for all of the species except the eastern gamagrass, which was planted at ¾-1” depth. All cultivars were planted on a pure live and non- dormant seed basis with 9 lb/ac for the big bluestem, 14 lb/ac for the eastern gamagrass, 9 lb/ac for the indiangrass, and 6 lb/ac for the switchgrass. A fixed amount of pelletized lime was used as a carrier for all of the species and varieties.
All plots were sprayed again with a mixture of glyphosate (41%) at 2 qt/ac and 0.5% nonionic surfactant at planting.
Plots were established on the following dates:
May 27, 2020: Blackstone
June 2, 2020: Glade Spring
June 11, 2020: Raphine
June 24, 2020: Suffolk
July 14, 2020: Middleburg
Rainfall from May through July at each location was within 1.5” of the 30-year precipitation mean for those three months. Approximately two months following planting, plots at all locations except for Blackstone were clipped with a rotary mower to remove weed biomass above the native grass seedlings. The mower was set to a height at or above the tallest height of the native grasses.
Germination Evaluation and Statistical Analysis
Seedling germination was evaluated around sixty days following establishment at Raphine and
Blackstone. A 0.5 m2 quadrat was placed directly in the center of each plot, and the number of native grass seedlings was counted within the quadrat.
Seedling count by cultivar was compared within a species using PROC MIXED in SAS Studio, v. 9.4 (SAS Inst., Cary, NC). Differences were considered significant when P ≤ 0.05 and as trends when 0.05 < P ≤ 0.10.
Harvest Management and Statistical Analysis
Plots were harvested once in 2021 at Raphine, Blackstone, and Suffolk. Plots were harvested twice in 2022 at those three locations and once at Middleburg. Plots were harvested once in 2023 at Middleburg and Glade Spring and twice at Raphine, Blackstone, and Suffolk. No fertilizer or soil amendments were applied to the plot area at any location for the duration of this test. After each harvest, all biomass was removed from the plots. The monthly precipitation for the county where each trial was located is presented in Appendix 6.
Cutting height was set to 5” for all plots at harvest. Total biomass harvested from the plot area was recorded, and a subsample was collected for dry matter corrections. The subsamples were dried in a forced oven at 135 °F for a minimum of four days before weighing. The dry matter correction was applied to the total fresh plot weight to calculate dry matter yield per unit area.
Prior to harvest, percent cover of the cultivar and the weed pressure by type of weed (grass, broadleaf, and sedge) was scored in each plot using a modified Daubenmire ranking scale (1: 0-5.0% cover; 2: 5.1-
25.0% cover; 3: 25.1-50.0% cover; 4: 50.1-75.0%
cover; 5: 75.1-95.0% cover; 6: 95.1-100.0% cover).
Plots were sprayed with 3 qt/ac pendimethalin (38.7%), 1 qt/ac glyphosate (41%) or 1 qt/ac triclopyr
(60.5%), and 0.5% non-ionic surfactant in April 2022 to reduce weed competition at all locations.
Forage dry matter yield by cultivar was compared within a species using PROC MIXED in SAS Studio,
v. 9.4 (SAS Inst., Cary, NC). Locations were analyzed separately for the tables presented in the appendices. Differences were considered significant when P ≤ 0.05 and as trends when 0.05 < P ≤ 0.10.
Results
Germination
Seedling count by cultivar is shown in Table 1. There tended to be a treatment (cultivar) by location interaction (P=0.0642). Some cultivars had lower germination than others, but by the second year, these differences had an indistinguishable effect on yield, likely due to germination of dormant seed and tillering of seedlings in the first year.
Species | Cultivar | LSM1 | SE2 |
BB | Niagara | 9.00 | 1.57 |
BB | KY Ecotype* | 1.00 | 1.57 |
BB | Kaw | 5.92 | 1.57 |
BB | Pawnee | 6.33 | 1.57 |
EG | Highlander* | 1.42 | 0.65 |
EG | Iuka IV | 4.67 | 0.65 |
EG | Pete | 3.58 | 0.65 |
IG | Cheyenne | 6.17 | 1.88 |
IG | NC Ecotype | 6.17 | 1.88 |
IG | Rumsey | 7.00 | 1.88 |
IG | KY Ecotype | 9.33 | 1.88 |
IG | Osage | 8.67 | 1.88 |
IG | GA Ecotype* | 0.75 | 1.88 |
IG | Holt | 9.25 | 1.88 |
SG | Shawnee* | 5.67 | 3.93 |
SG | Cave-in-Rock* | 6.33 | 3.93 |
SG | Performer | 11.17 | 3.93 |
Table 1: Seedling count by cultivar at Raphine and Blackstone locations 60 days following planting (BB: big bluestem; EG: eastern gamagrass; IG: indiangrass; SG: switchgrass)
SG | BoMaster | 10.25 | 3.93 |
SG | Alamo | 19.67 | 3.93 |
SG | Carthage** | 9.08 | 3.93 |
1 Least significant means
2 Standard error
*significantly different from the highest numerical value within the same species based on 0.05 LSD
**tended to be significantly different from the highest numerical value within the same species based on 0.10 LSD
Yield
Seasonal yields (sum of all of the harvests at a location each year) were analyzed within a species across all five locations. There was no treatment (cultivar) by location interaction for any of the species (P>0.05). However, there tended to be treatment by location interaction for indiangrass (P=0.0964).
Mean seasonal yields for each cultivar are presented as averages across all locations in Table 2. There were no significant differences in yields of cultivars within a species. However, cultivar tended to have a significant effect in the comparison of indiangrass due to the poor germination and growth of two cultivars, ‘NC ecotype’ and ‘KY ecotype.’ For these two cultivars, some of the plots were not harvested due to absence of the cultivar of interest.
Table 2: Seasonal yield (lb/acre) by cultivar across five locations in Virginia and over three seasons (BB: big bluestem; EG: eastern gamagrass; IG: indiangrass; SG: switchgrass; Non-est: non- estimable)
Species | Cultivar | LSM1 | SE2 |
BB | Niagara | 4,837 | 1,511 |
BB | KY Ecotype | 5,012 | 1,516 |
BB | Kaw | 4,318 | 1,502 |
BB | Pawnee | 4,094 | 1,523 |
EG | Highlander | 6,872 | 2,459 |
EG | Iuka IV | 6,150 | 2,463 |
EG | Pete | 6,736 | 2,461 |
IG | Cheyenne | 4,728 | 1,162 |
IG | NC Ecotype* | Non-est | . |
IG | Rumsey | 4,664 | 1,170 |
IG | KY Ecotype | 4,880 | 1,168 |
IG | Osage | 4,515 | 1,180 |
IG | GA Ecotype* | Non-est | . |
IG | Holt | 3,534 | 1,226 |
SG | Shawnee | 7,421 | 2,562 |
SG | Cave-in-Rock | 7,585 | 2,564 |
SG | Performer | 6,775 | 2,573 |
SG | BoMaster | 7,853 | 2,562 |
SG | Alamo | 7,700 | 2,568 |
SG | Carthage | 7,348 | 2,562 |
evaluating the results for these species at these locations.
1 Least significant means
2 Standard error
*tended to be significantly different from the highest numerical value within the same species based on 0.10 LSD
Although differences were not analyzed across species, it may be useful to note the greater yields of switchgrass and eastern gamagrass compared to big bluestem and indiangrass. While the two former species do in general produce more biomass than the two latter species, the yield data presented here are likely biased towards switchgrass and eastern gamagrass because they are earlier maturing species. Due to all species and plots within a location harvested on a single date once or twice a year, the earlier maturing species would indicate greater yields than the later maturing species. Farmers considering certain species for selection should consider nutritive value and palatability, however, not just forage yield.
Seasonal yields are also presented by year for each location in Appendices 7-11. Plots with insufficient cover of the target cultivar for a reliable estimation of yield within the plot were not harvested. Poor establishment of some species at some locations (e.g. indiangrass at Middleburg) resulted in very high standard errors. Thus, caution should be taken when
Germination and eventual productivity of indiangrass ecotypes (‘GA ecotype’ and ‘NC ecotype) were lower than for the other cultivars and ecotypes at four of the locations. This was a common pattern across all locations with the exception of Glade Spring, where indiangrass productivity was poor across cultivars and ecotypes due to poor establishment at this site.
Ecotypes are defined as seeds from an unimproved selection of seed from a given area. These varieties are thought to be better adapted to the region from which they were selected due to their extended period of evolution in that region. Cultivars, however, are improved lines of plants developed through selective breeding processes to target specific desired characteristics. These characteristics may include growth, forage nutritive value, and diseases resistance. As a result, improved cultivars often, but not always, may be expected to be higher yielding than ecotypes.
Conclusions
While this project yielded a substantial amount of information on the productivity of various cultivars and ecotypes of NWSG across Virginia, it also reinforced a few points that anyone interested in getting these species established for forage production or wildlife habitat may find helpful.
Germination of these perennial species can be slow, especially compared to the growth of nonnative annual weeds. Weed control through advanced site preparation and follow-up herbicide or mechanical control is imperative for the success of the planting. In addition, full productivity of these species may not be realized until two seasons following establishment.
Once these species are established, they can be very productive, even without fertilizer or lime applications. In the case of this variety trial, no soil amendments were applied to the plots despite the removal of biomass from the plots following each harvest. In a grazing system, these nutrients would be largely recycled through the grazing animals and thus very little soil amendments would be necessary for the optimum productivity of these species. In a hay production system where the vegetation is removed from the field year after year, it would be
advantageous to follow soil test nutrient recommendations when applying fertilizer and lime.
In general, the cultivars matured in the following order: eastern gamagrass, switchgrass, big bluestem, and indiangrass. This may be helpful information when selecting a species based on when forage is most needed and to prevent growing season overlap with the rest of the forage system. It is also not recommended to mix eastern gamagrass or switchgrass with plantings of the other species due to their more rapid rates of maturity. If a mixture of species is desired for forage production purposes, it is helpful to pair species and cultivars together with similar maturity rates so that harvest can be more appropriately timed to the needs of the crop.
Greater biomass yields may be useful in some contexts (maximizing yield for forage and biomass production purposes), but in some situations, such as in wildlife or conservation plantings, too much biomass may not be advantageous. In wildlife habitat plantings, a thinner grass sward may be more beneficial to small birds and mammals building nests and burrows within the stand. In these situations, ecotypes may be a better choice.
Acknowledgements
Seed for this trial was donated by Ernst Conservation Seeds, Gamagrass Seed Company, Garrett Wildflower Seed Farm, Roundstone Native Seed, and Star Seed, Inc.
This trial was made possible by the research farms and crews at each location and with the support of the Virginia Agricultural Experiment Station. A Conservation Innovation Grant from the United States Department of Agriculture Natural Resources Conservation Service provided funding for this work.
Visit Virginia Cooperative Extension: ext.vt.edu
Virginia Cooperative Extension is a partnership of Virginia Tech, Virginia State University, the U.S. Department of Agriculture, and local governments. Its programs and employment are open to all, regardless of age, color, disability, sex (including pregnancy), gender, gender identity, gender expression, national origin, political affiliation, race, religion, sexual orientation, genetic information, military status, or any other basis protected by law.
2023 SPES-562NP
Appendix 1: Soil map at the Middleburg AREC in Middleburg, Virginia with the location of the variety trial denoted with a black circle. The soil type this plot is planted on is a Purcellville silty clay loam, which is a deep, well-drained soil with high available soil moisture potential. The top two soil horizons have a silty clay loam texture down to approximately 20 inches and the next two horizons are a silt loam down to 64 inches. This is considered prime farmland with a land capability class 2e. A soil test from the site of the variety trial indicated 55 ppm phosphorus, 411 ppm potassium, 215 ppm magnesium, 1442 ppm calcium, 6.9% organic matter, and a pH of 6.3.
Appendix 2: Soil map at the Shenandoah Valley AREC in Raphine, Virginia with the location of the variety trial denoted with a black circle. The variety trial was planted on a Fluvaquent which is a mixed alluvial soil in the floodplain of this field. The soil is deep, naturally poorly drained and has a high water table near the soil surface over the winter months. The soil texture from the surface down to 9 inches is typically a fine sandy loam, from 9 – 33 inches is a sandy loam and from 33 – 67 inches is a sandy clay loam. This soil has a land capability class of 4w and meets hydric criteria. A soil test from the site of the variety trial indicated 22 ppm phosphorus, 60 ppm potassium, 195 ppm magnesium, 1574 ppm calcium, 6.4% organic matter, and a pH of 5.7.
Appendix 3: Soil map at the Southern Piedmont AREC in Blackstone, Virginia with the location of the variety trial denoted with a black circle. The variety trial was planted on a Durham coarse sandy loam. This soil is considered deep and well-drained with a moderate available water capacity. The soil texture from the surface down to 18 inches is a coarse sandy loam, then changes to a sandy clay loam down to 78 inches. The soil has a land capability class rating of 2e. A soil test from the site of the variety trial indicated 32 ppm phosphorus, 72 ppm potassium, 118 ppm magnesium, 506 ppm calcium, 2.6% organic matter, and a pH of 5.5.
Appendix 4: Soil map at the Southwest AREC in Glade Spring, Virginia with the location of the variety trial denoted with a black circle. The variety trial was planted on a Wyrick/Marbie silt loam complex. The Wyrick component is a deep, well-drained soil with high available water capacity with good production potential and a land capability classification of 2e. The typical Wyrick soil has a silt loam textured surface horizon down to 12 inches, and a silty clay loam down to 25 inches, and a silty clay down to 65 inches. The Marbie component has a root restrictive layer (fragipan) ranging between 18 and 36 inches resulting in a low available water capacity in this soil component. The typical Marbie has a soil textural class of silt loam from the surface down to 41 inches, and a silty clay loam from 41
– 65 inches. A soil test from the site of the variety trial indicated 199 ppm phosphorus, 239 ppm potassium, 153 ppm magnesium, 1094 ppm calcium, 3.5% organic matter, and a pH of 5.8.
Appendix 5: Soil map at the Tidewater AREC in Suffolk, Virginia with the location of the variety trial denoted with a black circle. The variety trial was planted across a field that had both a Rains fine sandy loam (19) and a Lynchburg fine sandy loam (14) soil. Both the Rains and Lynchburg soils are deep and poorly drained with a moderate available water holding capacity and a high, water table between 6 and 12 inches from the soil surface during the winter months. Both soils meet hydric criteria. The typical Rains soil has a fine sandy loam surface horizon in the top 6 inches above a sandy clay loam from 6 – 65 inches deep. The typical Lynchburg soil has a surface horizon of a loamy sand for the top 11 inches, above a sandy clay loam down to 47 inches above a sandy loam down to 65 inches. A soil test from the site of the variety trial indicated 31 ppm phosphorus, 45 ppm potassium, 109 ppm magnesium, 861 ppm calcium, 4.4% organic matter, and a pH of 5.2.
Appendix 6: Monthly precipitation by county for each variety trial location from January 2021 through September 2023. Data accessed from National Oceanic and Atmospheric Administration’s National Center for Environmental Information County Time Series (https://www.ncei.noaa.gov/access/monitoring/climate-at-a-glance/county/time- series/).
Augusta
Fauquier Washington Southampton Nottoway
9
8
7
6
Precipitation (in)
5
4
3
2
1
Jan-21
Feb-21 Mar-21 Apr-21 May-21 Jun-21 Jul-21 Aug-21 Sep-21 Oct-21 Nov-21 Dec-21 Jan-22 Feb-22 Mar-22 Apr-22 May-22 Jun-22 Jul-22 Aug-22 Sep-22 Oct-22 Nov-22 Dec-22 Jan-23 Feb-23 Mar-23 Apr-23 May-23 Jun-23 Jul-23 Aug-23 Sep-23
0
Appendix 7: Seasonal yield (lb/acre) by cultivar at the Middleburg AREC in Middleburg, Virginia over three seasons. Maturity rankings were collected at the first harvest of each year, and the maturity ranking was reported with the greatest number of plots recorded at that ranking. Plots at this location were harvested once in 2022 (August 17) and twice in 2023 (July 5 and September 15).
Species1 |
Cultivar | 2022 | 2023 | ||||
LSM2 | SE3 | Maturity4 | LSM2 | SE3 | Maturity4 | ||
BB | Niagara | 3,684 | 873 | R3 | 5,232 | 1,200 | R3 |
BB | KY Ecotype | 5,084 | 1,233 | R2 | 3,639 | 1,200 | E |
BB | Kaw | 5,261 | 725 | R3 | 4,125 | 871 | R1 |
BB | Pawnee | 5,250 | 873 | R3 | 4,051 | 1,220 | R1 |
EG | Highlander | 5,887 | 1,035 | S | 6,652* | 1,035 | S |
EG | Iuka IV | 5,768 | 1,195 | S | 11,554 | 1,464 | S |
EG | Pete | 5,558 | 1,035 | S | 6,048* | 1,464 | S |
IG | Cheyenne | 6,417 | 5,041 | S | 5,373 | 5,041 | E |
IG | NC Ecotype5 | . | . | E | . | . | E |
IG | Rumsey | 5,288 | 5,041 | R1 | 5,332 | 5,041 | E |
IG | KY Ecotype | 5,369 | 5,029 | E | . | . | E |
IG | Osage | 4,317 | 5,833 | E | 3,508 | 5,833 | E |
IG | GA Ecotype5 | . | . | E | . | . | V |
IG | Holt | 4,789 | 7,570 | S | . | . | R1 |
SG | Shawnee | 4,653 | 1,548 | S | 8,257 | 1,726 | R1 |
SG | Cave-in-Rock | 4,757 | 1,729 | S | 8,540 | 1,730 | R1 |
SG | Performer | 8,739 | 2,144 | S | 6,166 | 2,144 | E |
SG | BoMaster | 7,212 | 1,725 | S | 9,874 | 1,548 | E |
SG | Alamo | 6,754 | 2,070 | R2 | 10,096 | 1,768 | E |
SG | Carthage | 6,565 | 1,725 | S | 6,526 | 1,548 | R1 |
1 Species: BB = big bluestem, EG = eastern gamagrass, IG = indiangrass, SG = switchgrass
2 Least significant means
3 Standard error
4 Maturity ranking: V = vegetative, E = elongating, R1 = boot stage, R2 = fully emerged, R3 = anthesis, S = mature seed
5 Insufficient data to report
* Yield was significantly different from the highest numerical value within the same species based on 0.05 LSD
Appendix 8: Seasonal yield (lb/acre) by cultivar at the Shenandoah Valley AREC in Raphine, Virginia over three seasons. Maturity rankings were collected at the first harvest of each year, and the maturity ranking was reported with the greatest number of plots recorded at that ranking. Plots at this location were harvested once in 2021 (November 5), twice in 2022 (June 29 and August 31), and twice in 2023 (July 11 and September 6).
Species1 |
Cultivar | 2021 | 2022 | 2023 | |||||
LSM2 | SE3 | LSM2 | SE3 | Maturity4 | LSM2 | SE3 | Maturity4 | ||
BB | Niagara | 968 | 467 | 7,006 | 528 | V | 4,154 | 528 | R2 |
BB | KY Ecotype | 522 | 467 | 7,001 | 467 | V | 4,886 | 467 | V |
BB | Kaw | 454 | 467 | 8,068 | 467 | V | 5,568 | 467 | E |
BB | Pawnee | 871 | 467 | 6,403 | 528 | V | 5,621 | 852 | V |
EG | Highlander | 1,352 | 1,416 | 11,231 | 1,416 | E | 11,735 | 1,416 | S |
EG | Iuka IV | 1,854 | 1,416 | 10,356 | 1,416 | R3 | 11,785 | 1,416 | S |
EG | Pete | 1,400 | 1,416 | 12,364 | 1,416 | R3 | 13,669 | 1,416 | S |
IG | Cheyenne | 1,522 | 661 | 9,187 | 738 | V | 5,009 | 738 | V |
IG | NC Ecotype | 1,373 | 661 | 6,736* | 738 | V | 2,547* | 860 | V |
IG | Rumsey | 1,119 | 661 | 9,303 | 661 | V | 5,354 | 732 | V |
IG | KY Ecotype | 1,411 | 661 | 8,706 | 738 | V | 5,379 | 738 | V |
IG | Osage | 1,853 | 661 | 9,679 | 661 | V | 5,212 | 732 | V |
IG | GA Ecotype | 420 | 661 | 3,087* | 661 | V | 1,455* | 1,147 | V |
IG | Holt | 941 | 661 | 9,665 | 661 | V | 6,198 | 732 | V |
SG | Shawnee | 1,055 | 948 | 14,198 | 948 | E | 7,523 | 948 | R1 |
SG | Cave-in-Rock | 1,165 | 948 | 13,223** | 948 | E | 7,176 | 948 | R1 |
SG | Performer | 1,779 | 948 | 14,636 | 1,084 | E | 4,602* | 1,084 | E |
SG | BoMaster | 1,670 | 948 | 15,536 | 948 | E | 4,681* | 948 | E |
SG | Alamo | 2,553 | 948 | 13,844 | 948 | E | 3,759* | 948 | E |
SG | Carthage | 1,082 | 948 | 10,161* | 948 | E | 5,849 | 948 | R1 |
1 Species: BB = big bluestem, EG = eastern gamagrass, IG = indiangrass, SG = switchgrass
2 Least significant means
3 Standard error
4 Maturity ranking: V = vegetative, E = elongating, R1 = boot stage, R2 = fully emerged, R3 = anthesis, S = mature seed
* Yield was significantly different from the highest numerical value within the same species based on 0.05 LSD
** Yield tended to be significantly different from the highest numerical value within the same species based on 0.10 LSD
Appendix 9: Seasonal yield (lb/acre) by cultivar at the Southern Piedmont AREC in Blackstone, Virginia over three seasons. Plots at this location were harvested once in 2021 (September 16), twice in 2022 (June 14 and September 13), and twice in 2023 (June 15 and October 4).
Species1 |
Cultivar | 2021 | 2022 | 2023 | |||
LSM2 | SE3 | LSM2 | SE3 | LSM2 | SE3 | ||
BB | Niagara | 3,553 | 1,091 | 9,343 | 1,091 | 9,674 | 1,091 |
BB | KY Ecotype | 4,142 | 1,091 | 7,576 | 1,091 | 7,829 | 1,091 |
BB | Kaw | 4,305 | 1,091 | 8,341 | 1,091 | 9,290 | 1,091 |
BB | Pawnee | 4,200 | 1,091 | 6,850** | 1,091 | 10,112 | 1,091 |
EG | Highlander | 3,794 | 854 | 10,487 | 854 | 12,650 | 854 |
EG | Iuka IV | 3,787 | 854 | 9,167 | 854 | 9,738* | 854 |
EG | Pete | 4,229 | 854 | 11,220 | 854 | 11,572 | 854 |
IG | Cheyenne | 3,475 | 678 | 4,663* | 678 | 6,754** | 678 |
IG | NC Ecotype | 3,602 | 678 | 5,680* | 678 | 6,876** | 678 |
IG | Rumsey | 4,703 | 678 | 6,543 | 678 | 7,552 | 678 |
IG | KY Ecotype | 3,876 | 678 | 7,696 | 678 | 7,557 | 678 |
IG | Osage | 4,467 | 678 | 6,443 | 678 | 8,412 | 678 |
IG | GA Ecotype | 2,963* | 678 | 5,073* | 678 | 6,547* | 678 |
IG | Holt | 3,416 | 678 | 4,142* | 678 | 4,342* | 678 |
SG | Shawnee | 4,862 | 1,010 | 14,773 | 1,010 | 15,634 | 1,010 |
SG | Cave-in-Rock | 3,891** | 1,010 | 11,734* | 1,010 | 14,784 | 1,010 |
SG | Performer | 6,046 | 1,010 | 12,467 | 1,010 | 11,999* | 1,010 |
SG | BoMaster | 5,618 | 1,010 | 10,453* | 1,010 | 12,360* | 1,010 |
SG | Alamo | 6,556 | 1,010 | 12,664 | 1,010 | 14,881 | 1,010 |
SG | Carthage | 4,795 | 1,010 | 11,193* | 1,010 | 14,217 | 1,010 |
1 Species: BB = big bluestem, EG = eastern gamagrass, IG = indiangrass, SG = switchgrass
2 Least significant means
3 Standard error
* Yield was significantly different from the highest numerical value within the same species based on 0.05 LSD
** Yield tended to be significantly different from the highest numerical value within the same species based on 0.10 LSD
Appendix 10: Seasonal yield (lb/acre) by cultivar at the Southwest AREC in Glade Spring, Virginia over three seasons. Maturity rankings were collected at the first harvest of each year, and the maturity ranking was reported with the greatest number of plots recorded at that ranking. Plots at this location were harvested twice in 2023 (July 7 and September 12).
Species1 |
Cultivar | 2023 | ||
LSM2 | SE3 | Maturity4 | ||
BB | Niagara | 5,276 | 1,554 | R3 |
BB | KY Ecotype | 7,903 | 1,355 | E |
BB | Kaw | 2,619* | 1,554 | E |
BB | Pawnee | 2,653** | 1,883 | E |
EG | Highlander | 11,377 | 2,028 | R1 |
EG | Iuka IV | 8,219 | 2,028 | R3 |
EG | Pete | 10,420 | 2,028 | R3 |
IG | Cheyenne | 4,011 | 737 | E |
IG | NC Ecotype | 4,046 | 638 | V |
IG | Rumsey | 4,718 | 902 | E |
IG | KY Ecotype | 4,563 | 737 | V |
IG | Osage | 3,009 | 902 | E |
IG | GA Ecotype | 3,396 | 902 | V |
IG | Holt | 2,621 | 902 | E |
SG | Shawnee | 9,897 | 1,542 | E |
SG | Cave-in-Rock | 9,265 | 1,542 | R1 |
SG | Performer | 6,191* | 1,542 | E |
SG | BoMaster | 9,321 | 1,542 | E |
SG | Alamo | 5,969* | 1,542 | E |
SG | Carthage | 10,801 | 1,542 | E |
1 Species: BB = big bluestem, EG = eastern gamagrass, IG = indiangrass, SG = switchgrass
2 Least significant means
3 Standard error
4 Maturity ranking: V = vegetative, E = elongating, R1 = boot stage, R2 = fully emerged, R3 = anthesis, S = mature seed
* Yield was significantly different from the highest numerical value within the same species based on 0.05 LSD
** Yield tended to be significantly different from the highest numerical value within the same species based on 0.10 LSD
Appendix 11: Seasonal yield (lb/acre) by cultivar at the Tidewater AREC in Suffolk, Virginia over three seasons. Plots at this location were harvested once in 2021 (September 15), twice in 2022 (June 27 and September 7), and twice in 2023 (June 14 and September 14).
Species1 |
Cultivar | 2021 | 2022 | 2023 | |||
LSM2 | SE3 | LSM2 | SE3 | LSM2 | SE3 | ||
BB | Niagara | 3,282 | 1,274 | 4,531 | 1274 | 9,042 | 1274 |
BB | KY Ecotype | 2,436 | 1,274 | 3,745 | 1274 | 8,273 | 1274 |
BB | Kaw | 3,297 | 1,274 | 6,032 | 1274 | 5,916** | 1274 |
BB | Pawnee | 3,439 | 1,274 | 3,553 | 1274 | 5,953** | 1274 |
EG | Highlander | 2,170 | 905 | 4,199 | 905 | 4,199 | 905 |
EG | Iuka IV | 1,791 | 905 | 3,980 | 905 | 3,980** | 905 |
EG | Pete | 2,587 | 905 | 3,652 | 905 | 3,652 | 905 |
IG | Cheyenne | 3,127 | 986 | 6,923 | 986 | 8,313 | 986 |
IG | NC Ecotype | 3,128 | 986 | 2,773* | 986 | 7,953 | 986 |
IG | Rumsey | 2,861 | 986 | 2,528* | 986 | 5,122* | 986 |
IG | KY Ecotype | 3,237 | 986 | 4,194** | 986 | 7,234 | 986 |
IG | Osage | 3,638 | 986 | 4,286** | 986 | 6,622 | 986 |
IG | GA Ecotype | 2,802 | 986 | 3,066* | 986 | 3,399* | 986 |
IG | Holt | 2,632 | 986 | 2,565* | 986 | 5,739** | 986 |
SG | Shawnee | 3,814 | 1,697 | 6,254** | 1697 | 10,405* | 1697 |
SG | Cave-in-Rock | 3,785 | 1,697 | 7,732 | 1697 | 17,193 | 1697 |
SG | Performer | 4,329 | 1,697 | 8,912 | 1697 | 10,119* | 1697 |
SG | BoMaster | 5,037 | 1,697 | 9,409 | 1697 | 11,541* | 1697 |
SG | Alamo | 4,986 | 1,697 | 10,410 | 1697 | 16,895 | 1697 |
SG | Carthage | 3,986 | 1,697 | 8,579 | 1697 | 14,317 | 1697 |
1 Species: BB = big bluestem, EG = eastern gamagrass, IG = indiangrass, SG = switchgrass
2 Least significant means
3 Standard error
* Yield was significantly different from the highest numerical value within the same species based on 0.05 LSD
** Yield tended to be significantly different from the highest numerical value within the same species based on 0.10 LSD
Establishment
A mixture of glyphosate (41%) at 2 qt/ac and 0.5% nonionic surfactant was sprayed on plot areas the fall prior to seeding, except for the Middleburg location which was sprayed one week prior to seedbed preparation. Seedbeds were prepared for planting through discing following by harrowing or rototillage. The plots were then rested for a minimum of one week to allow the soil to settle, with the exception of the Raphine location which was cultipacked immediately following tillage.
Plot sizes were six by ten feet with four replications per cultivar. A Carter forage plot seeder was used to seed all of the species except the eastern gamagrass, which was planted with a single row push corn planter in four strips per plot due to the large seed size of this species. Seeding depth was less than ¼” of an inch for all of the species except the eastern gamagrass, which was planted at ¾-1” depth. All cultivars were planted on a pure live and non-dormant seed basis with 9 lb/ac for the big bluestem, 14 lb/ac for the eastern gamagrass, 9 lb/ac for the indiangrass, and 6 lb/ac for the switchgrass. A fixed amount of pelletized lime was used as a carrier for all of the species and varieties.
All plots were sprayed again with a mixture of glyphosate (41%) at 2 qt/ac and 0.5% nonionic surfactant at planting.
Plots were established on the following dates:
- May 27, 2020: Blackstone
- June 2, 2020: Glade Spring
- June 11, 2020: Raphine
- June 24, 2020: Suffolk
- July 14, 2020: Middleburg
Rainfall from May through July at each location was within 1.5” of the 30-year precipitation mean for those three months.
Approximately two months following planting, plots at all locations except for Blackstone were clipped with a rotary mower to remove weed biomass above the native grass seedlings. The mower was set to a height at or above the tallest height of the native grasses.
Germination Evaluation and Statistical Analysis
Seedling germination was evaluated around sixty days following establishment at Raphine and Blackstone. A 0.5 m2 quadrat was placed directly in the center of each plot, and the number of native grass seedlings was counted within the quadrat.
Seedling count by cultivar was compared within a species using PROC MIXED in SAS Studio, v. 9.4 (SAS Inst., Cary, NC). Differences were considered significant when P ≤ 0.05 and as trends when 0.05 < P ≤ 0.10.
Harvest Management and Statistical Analysis
Plots were harvested once in 2021 at Raphine, Blackstone, and Suffolk. Plots were harvested twice in 2022 at those three locations and once at Middleburg. Plots were harvested once in 2023 at Middleburg and Glade Spring and twice at Raphine, Blackstone, and Suffolk. No fertilizer or soil amendments were applied to the plot area at any location for the duration of this test. After each harvest, all biomass was removed from the plots. The monthly precipitation for the county where each trial was located is presented in Appendix 6.
Cutting height was set to 5” for all plots at harvest. Total biomass harvested from the plot area was recorded, and a subsample was collected for dry matter corrections. The subsamples were dried in a forced oven at 135 °F for a minimum of four days before weighing. The dry matter correction was applied to the total fresh plot weight to calculate dry matter yield per unit area.
Prior to harvest, percent cover of the cultivar and the weed pressure by type of weed (grass, broadleaf, and sedge) was scored in each plot using a modified Daubenmire ranking scale (1: 0-5.0% cover; 2: 5.1-25.0% cover; 3: 25.1-50.0% cover; 4: 50.1-75.0% cover; 5: 75.1-95.0% cover; 6: 95.1-100.0% cover).
Plots were sprayed with 3 qt/ac pendimethalin (38.7%), 1 qt/ac glyphosate (41%) or 1 qt/ac triclopyr (60.5%), and 0.5% non-ionic surfactant in April 2022 to reduce weed competition at all locations.
Forage dry matter yield by cultivar was compared within a species using PROC MIXED in SAS Studio, v. 9.4 (SAS Inst., Cary, NC). Locations were analyzed separately for the tables presented in the appendices. Differences were considered significant when P ≤ 0.05 and as trends when 0.05 < P ≤ 0.10.
Results
Germination
Seedling count by cultivar is shown in Table 1. There tended to be a treatment (cultivar) by location interaction (P=0.0642). Some cultivars had lower germination than others, but by the second year, these differences had an indistinguishable effect on yield, likely due to germination of dormant seed and tillering of seedlings in the first year.
Species | Cultivar | LSM1 | SE2 |
|---|---|---|---|
BB | Niagara | 9.0 | 1.6 |
BB | KY Ecotype* | 1.0 | 1.6 |
BB | Kaw | 5.9 | 1.6 |
BB | Pawnee | 6.3 | 1.6 |
EG | Highlander* | 1.4 | 0.7 |
EG | Iuka IV | 4.7 | 0.7 |
EG | Pete | 3.6 | 0.7 |
IG | Cheyenne | 6.2 | 1.9 |
IG | NC Ecotype | 6.2 | 1.9 |
IG | Rumsey | 7.0 | 1.9 |
IG | KY Ecotype | 9.3 | 1.9 |
IG | Osage | 8.7 | 1.9 |
IG | GA Ecotype* | 0.8 | 1.9 |
IG | Holt | 9.3 | 1.9 |
SG | Shawnee* | 5.7 | 3.9 |
SG | Cave-in-Rock* | 6.3 | 3.9 |
SG | Performer | 11.2 | 3.9 |
SG | BoMaster | 10.3 | 3.9 |
SG | Alamo | 19.7 | 3.9 |
SG | Carthage** | 9.1 | 3.9 |
1 Least significant means
2 Standard error
*significantly different from the highest numerical value within the same species based on 0.05 LSD
**tended to be significantly different from the highest numerical value within the same species based on 0.10 LSD
Yield
Seasonal yields (sum of all of the harvests at a location each year) were analyzed within a species across all five locations. There was no treatment (cultivar) by location interaction for any of the species (P>0.05). However, there tended to be treatment by location interaction for indiangrass (P=0.0964).
Mean seasonal yields for each cultivar are presented as averages across all locations in Table 2. There were no significant differences in yields of cultivars within a species. However, cultivar tended to have a significant effect in the comparison of indiangrass due to the poor germination and growth of two cultivars, ‘NC ecotype’ and ‘KY ecotype.’ For these two cultivars, some of the plots were not harvested due to absence of the cultivar of interest.
Species | Cultivar | LSM1 | SE2 |
|---|---|---|---|
BB | Niagara | 2.4 | 0.8 |
BB | KY Ecotype | 2.5 | 0.8 |
BB | Kaw | 2.2 | 0.8 |
BB | Pawnee | 2.0 | 0.8 |
EG | Highlander | 3.4 | 1.2 |
EG | Iuka IV | 3.1 | 1.2 |
EG | Pete | 3.4 | 1.2 |
IG | Cheyenne | 2.4 | 0.6 |
IG | NC Ecotype | Non-est | Non-est |
IG | Rumsey | 2.3 | 0.6 |
IG | KY Ecotype | 2.4 | 0.6 |
IG | Osage | 2.3 | 0.6 |
IG | GA Ecotype | Non-est | Non-est |
IG | Holt | 1.8 | 0.6 |
SG | Shawnee | 3.7 | 1.3 |
SG | Cave-in-Rock | 3.8 | 1.3 |
SG | Performer | 3.4 | 1.3 |
SG | BoMaster | 3.9 | 1.3 |
SG | Alamo | 3.9 | 1.3 |
SG | Carthage | 3.7 | 1.3 |
1 Least significant means
2 Standard error
*tended to be significantly different from the highest numerical value within the same species based on 0.10 LSD
Although differences were not analyzed across species, it may be useful to note the greater yields of switchgrass and eastern gamagrass compared to big bluestem and indiangrass. While the two former species do in general produce more biomass than the two latter species, the yield data presented here are likely biased towards switchgrass and eastern gamagrass because they are earlier maturing species. Due to all species and plots within a location harvested on a single date once or twice a year, the earlier maturing species would indicate greater yields than the later maturing species. Farmers considering certain species for selection should consider nutritive value and palatability, however, not just forage yield.
Seasonal yields are also presented by year for each location in Appendices 7-11. Plots with insufficient cover of the target cultivar for a reliable estimation of yield within the plot were not harvested. Poor establishment of some species at some locations (e.g. indiangrass at Middleburg) resulted in very high standard errors. Thus, caution should be taken when
Germination and eventual productivity of indiangrass ecotypes (‘GA ecotype’ and ‘NC ecotype) were lower than for the other cultivars and ecotypes at four of the locations. This was a common pattern across all locations with the exception of Glade Spring, where indiangrass productivity was poor across cultivars and ecotypes due to poor establishment at this site.
Ecotypes are defined as seeds from an unimproved selection of seed from a given area. These varieties are thought to be better adapted to the region from which they were selected due to their extended period of evolution in that region. Cultivars, however, are improved lines of plants developed through selective breeding processes to target specific desired characteristics. These characteristics may include growth, forage nutritive value, and diseases resistance. As a result, improved cultivars often, but not always, may be expected to be higher yielding than ecotypes.
Conclusions
While this project yielded a substantial amount of information on the productivity of various cultivars and ecotypes of NWSG across Virginia, it also reinforced a few points that anyone interested in getting these species established for forage production or wildlife habitat may find helpful.
Germination of these perennial species can be slow, especially compared to the growth of nonnative annual weeds. Weed control through advanced site preparation and follow-up herbicide or mechanical control is imperative for the success of the planting. In addition, full productivity of these species may not be realized until two seasons following establishment.
Once these species are established, they can be very productive, even without fertilizer or lime applications. In the case of this variety trial, no soil amendments were applied to the plots despite the removal of biomass from the plots following each harvest. In a grazing system, these nutrients would be largely recycled through the grazing animals and thus very little soil amendments would be necessary for the optimum productivity of these species. In a hay production system where the vegetation is removed from the field year after year, it would be advantageous to follow soil test nutrient recommendations when applying fertilizer and lime.
In general, the cultivars matured in the following order: eastern gamagrass, switchgrass, big bluestem, and indiangrass. This may be helpful information when selecting a species based on when forage is most needed and to prevent growing season overlap with the rest of the forage system. It is also not recommended to mix eastern gamagrass or switchgrass with plantings of the other species due to their more rapid rates of maturity. If a mixture of species is desired for forage production purposes, it is helpful to pair species and cultivars together with similar maturity rates so that harvest can be more appropriately timed to the needs of the crop.
Greater biomass yields may be useful in some contexts (maximizing yield for forage and biomass production purposes), but in some situations, such as in wildlife or conservation plantings, too much biomass may not be advantageous. In wildlife habitat plantings, a thinner grass sward may be more beneficial to small birds and mammals building nests and burrows within the stand. In these situations, ecotypes may be a better choice.
Acknowledgements
Seed for this trial was donated by Ernst Conservation Seeds, Gamagrass Seed Company, Garrett Wildflower Seed Farm, Roundstone Native Seed, and Star Seed, Inc.
This trial was made possible by the research farms and crews at each location and with the support of the Virginia Agricultural Experiment Station. A Conservation Innovation Grant from the United States Department of Agriculture Natural Resources Conservation Service provided funding for this work.
Species1 | Cultivar | 2022 | 2022 SE3 | 2022 Maturity4 | 2023 | 2023 SE3 | 2023 Maturity4 |
|---|---|---|---|---|---|---|---|
BB | Niagara | 1.8 | 0.4 | R3 | 2.6 | 0.6 | R3 |
BB | KY Ecotype | 2.5 | 0.6 | R2 | 1.8 | 0.6 | E |
BB | Kaw | 2.6 | 0.4 | R3 | 2.1 | 0.4 | R1 |
BB | Pawnee | 2.6 | 0.4 | R3 | 2.0 | 0.6 | R1 |
EG | Highlander | 2.9 | 0.5 | S | 3.3* | 0.5 | S |
EG | Iuka IV | 2.9 | 0.6 | S | 5.8 | 0.7 | S |
EG | Pete | 2.8 | 0.5 | S | 3.0* | 0.7 | S |
IG | Cheyenne | 3.2 | 2.5 | S | 2.7 | 2.5 | E |
IG | NC Ecotype5 | . | . | E | . | . | E |
IG | Rumsey | 2.6 | 2.5 | R1 | 2.7 | 2.5 | E |
IG | KY Ecotype | 2.7 | 2.5 | E | . | . | E |
IG | Osage | 2.2 | 2.9 | E | 1.8 | 2.9 | E |
IG | GA Ecotype5 | . | . | E | . | . | V |
IG | Holt | 2.4 | 3.8 | S | . | . | R1 |
SG | Shawnee | 2.3 | 0.8 | S | 4.1 | 0.9 | R1 |
SG | Cave-in-Rock | 2.4 | 0.9 | S | 4.3 | 0.9 | R1 |
SG | Performer | 4.4 | 1.1 | S | 3.1 | 1.1 | E |
SG | BoMaster | 3.6 | 0.9 | S | 4.9 | 0.8 | E |
SG | Alamo | 3.4 | 1.0 | R2 | 5.0 | 0.9 | E |
SG | Carthage | 3.3 | 0.9 | S | 3.3 | 0.8 | R1 |
1 Species: BB = big bluestem, EG = eastern gamagrass, IG = indiangrass, SG = switchgrass
2 Least significant means
3 Standard error
4 Maturity ranking: V = vegetative, E = elongating, R1 = boot stage, R2 = fully emerged, R3 = anthesis, S = mature seed
5 Insufficient data to report
* Yield was significantly different from the highest numerical value within the same species based on 0.05 LSD
Species1 | Cultivar | 2021 | 2021 SE3 | 2022 | 2022 SE3 | 2022 Maturity4 | 2023 | 2023 SE3 | 2023 Maturity4 |
|---|---|---|---|---|---|---|---|---|---|
BB | Niagara | 0.5 | 0.2 | 3.5 | 0.3 | V | 2.1 | 0.3 | R2 |
BB | KY Ecotype | 0.3 | 0.2 | 3.5 | 0.2 | V | 2.4 | 0.2 | V |
BB | Kaw | 0.2 | 0.2 | 4.0 | 0.2 | V | 2.8 | 0.2 | E |
BB | Pawnee | 0.4 | 0.2 | 3.2 | 0.3 | V | 2.8 | 0.4 | V |
EG | Highlander | 0.7 | 0.7 | 5.6 | 0.7 | E | 5.9 | 0.7 | S |
EG | Iuka IV | 0.9 | 0.7 | 5.2 | 0.7 | R3 | 5.9 | 0.7 | S |
EG | Pete | 0.7 | 0.7 | 6.2 | 0.7 | R3 | 6.8 | 0.7 | S |
IG | Cheyenne | 0.8 | 0.3 | 4.6 | 0.4 | V | 2.5 | 0.4 | V |
IG | NC Ecotype | 0.7 | 0.3 | 3.4* | 0.4 | V | 1.3* | 0.4 | V |
IG | Rumsey | 0.6 | 0.3 | 4.7 | 0.3 | V | 2.7 | 0.4 | V |
IG | KY Ecotype | 0.7 | 0.3 | 4.4 | 0.4 | V | 2.7 | 0.4 | V |
IG | Osage | 0.9 | 0.3 | 4.8 | 0.3 | V | 2.6 | 0.4 | V |
IG | GA Ecotype | 0.2 | 0.3 | 1.5* | 0.3 | V | 0.7* | 0.6 | V |
IG | Holt | 0.5 | 0.3 | 4.8 | 0.3 | V | 3.1 | 0.4 | V |
SG | Shawnee | 0.5 | 0.5 | 7.1 | 0.5 | E | 3.8 | 0.5 | R1 |
SG | Cave-in-Rock | 0.6 | 0.5 | 6.6** | 0.5 | E | 3.6 | 0.5 | R1 |
SG | Performer | 0.9 | 0.5 | 7.3 | 0.5 | E | 2.3* | 0.5 | E |
SG | BoMaster | 0.8 | 0.5 | 7.8 | 0.5 | E | 2.3* | 0.5 | E |
SG | Alamo | 1.3 | 0.5 | 6.9 | 0.5 | E | 1.9* | 0.5 | E |
SG | Carthage | 0.5 | 0.5 | 5.1* | 0.5 | E | 2.9 | 0.5 | R1 |
1 Species: BB = big bluestem, EG = eastern gamagrass, IG = indiangrass, SG = switchgrass
2 Least significant means
3 Standard error
4 Maturity ranking: V = vegetative, E = elongating, R1 = boot stage, R2 = fully emerged, R3 = anthesis, S = mature seed
* Yield was significantly different from the highest numerical value within the same species based on 0.05 LSD
** Yield tended to be significantly different from the highest numerical value within the same species based on 0.10 LSD
Species1 | Cultivar | 2021 | 2021 SE3 | 2022 | 2022 SE3 | 2023 | 2023 SE3 |
|---|---|---|---|---|---|---|---|
BB | Niagara | 1.8 | 0.5 | 4.7 | 0.5 | 4.8 | 0.5 |
BB | KY Ecotype | 2.1 | 0.5 | 3.8 | 0.5 | 3.9 | 0.5 |
BB | Kaw | 2.2 | 0.5 | 4.2 | 0.5 | 4.6 | 0.5 |
BB | Pawnee | 2.1 | 0.5 | 3.4** | 0.5 | 5.1 | 0.5 |
EG | Highlander | 1.9 | 0.4 | 5.2 | 0.4 | 6.3 | 0.4 |
EG | Iuka IV | 1.9 | 0.4 | 4.6 | 0.4 | 4.9* | 0.4 |
EG | Pete | 2.1 | 0.4 | 5.6 | 0.4 | 5.8 | 0.4 |
IG | Cheyenne | 1.7 | 0.3 | 2.3* | 0.3 | 3.4** | 0.3 |
IG | NC Ecotype | 1.8 | 0.3 | 2.8* | 0.3 | 3.4** | 0.3 |
IG | Rumsey | 2.4 | 0.3 | 3.3 | 0.3 | 3.8 | 0.3 |
IG | KY Ecotype | 1.9 | 0.3 | 3.8 | 0.3 | 3.8 | 0.3 |
IG | Osage | 2.2 | 0.3 | 3.2 | 0.3 | 4.2 | 0.3 |
IG | GA Ecotype | 1.5* | 0.3 | 2.5* | 0.3 | 3.3* | 0.3 |
IG | Holt | 1.7 | 0.3 | 2.1* | 0.3 | 2.2* | 0.3 |
SG | Shawnee | 2.4 | 0.5 | 7.4 | 0.5 | 7.8 | 0.5 |
SG | Cave-in-Rock | 1.9** | 0.5 | 5.9* | 0.5 | 7.4 | 0.5 |
SG | Performer | 3.0 | 0.5 | 6.2 | 0.5 | 6.0* | 0.5 |
SG | BoMaster | 2.8 | 0.5 | 5.2* | 0.5 | 6.2* | 0.5 |
SG | Alamo | 3.3 | 0.5 | 6.3 | 0.5 | 7.4 | 0.5 |
SG | Carthage | 2.4 | 0.5 | 5.6* | 0.5 | 7.1 | 0.5 |
1 Species: BB = big bluestem, EG = eastern gamagrass, IG = indiangrass, SG = switchgrass
2 Least significant means
3 Standard error
* Yield was significantly different from the highest numerical value within the same species based on 0.05 LSD
** Yield tended to be significantly different from the highest numerical value within the same species based on 0.10 LSD
Species1 | Cultivar | 2023 | 2023 SE3 | 2023 Maturity4 |
|---|---|---|---|---|
BB | Niagara | 2.6 | 0.8 | R3 |
BB | KY Ecotype | 4.0 | 0.7 | E |
BB | Kaw | 1.3* | 0.8 | E |
BB | Pawnee | 1.3** | 0.9 | E |
EG | Highlander | 5.7 | 1.0 | R1 |
EG | Iuka IV | 4.1 | 1.0 | R3 |
EG | Pete | 5.2 | 1.0 | R3 |
IG | Cheyenne | 2.0 | 0.4 | E |
IG | NC Ecotype | 2.0 | 0.3 | V |
IG | Rumsey | 2.4 | 0.5 | E |
IG | KY Ecotype | 2.3 | 0.4 | V |
IG | Osage | 1.5 | 0.5 | E |
IG | GA Ecotype | 1.7 | 0.5 | V |
IG | Holt | 1.3 | 0.5 | E |
SG | Shawnee | 4.9 | 0.8 | E |
SG | Cave-in-Rock | 4.6 | 0.8 | R1 |
SG | Performer | 3.1* | 0.8 | E |
SG | BoMaster | 4.7 | 0.8 | E |
SG | Alamo | 3.0* | 0.8 | E |
SG | Carthage | 5.4 | 0.8 | E |
1 Species: BB = big bluestem, EG = eastern gamagrass, IG = indiangrass, SG = switchgrass
2 Least significant means
3 Standard error
4 Maturity ranking: V = vegetative, E = elongating, R1 = boot stage, R2 = fully emerged, R3 = anthesis, S = mature seed
* Yield was significantly different from the highest numerical value within the same species based on 0.05 LSD
** Yield tended to be significantly different from the highest numerical value within the same species based on 0.10 LSD
Species1 | Cultivar | 2021 | 2021 SE3 | 2022 | 2022 SE3 | 2023 | 2023 SE3 |
|---|---|---|---|---|---|---|---|
BB | Niagara | 1.6 | 0.6 | 2.3 | 0.6 | 4.5 | 0.6 |
BB | KY Ecotype | 1.2 | 0.6 | 1.9 | 0.6 | 4.1 | 0.6 |
BB | Kaw | 1.6 | 0.6 | 3.0 | 0.6 | 3.0** | 0.6 |
BB | Pawnee | 1.7 | 0.6 | 1.8 | 0.6 | 3.0** | 0.6 |
EG | Highlander | 1.1 | 0.5 | 2.1 | 0.5 | 4.8 | 0.5 |
EG | Iuka IV | 0.9 | 0.5 | 2.0 | 0.5 | 3.6** | 0.5 |
EG | Pete | 1.3 | 0.5 | 1.8 | 0.5 | 3.9 | 0.5 |
IG | Cheyenne | 1.6 | 0.5 | 3.5 | 0.5 | 4.2 | 0.5 |
IG | NC Ecotype | 1.6 | 0.5 | 1.4* | 0.5 | 4.0 | 0.5 |
IG | Rumsey | 1.4 | 0.5 | 1.3* | 0.5 | 2.6* | 0.5 |
IG | KY Ecotype | 1.6 | 0.5 | 2.1** | 0.5 | 3.6 | 0.5 |
IG | Osage | 1.8 | 0.5 | 2.1** | 0.5 | 3.3 | 0.5 |
IG | GA Ecotype | 1.4 | 0.5 | 1.5* | 0.5 | 1.7* | 0.5 |
IG | Holt | 1.3 | 0.5 | 1.3* | 0.5 | 2.9** | 0.5 |
SG | Shawnee | 1.9 | 0.8 | 3.1** | 0.8 | 5.2* | 0.8 |
SG | Cave-in-Rock | 1.9 | 0.8 | 3.9 | 0.8 | 8.6 | 0.8 |
SG | Performer | 2.2 | 0.8 | 4.5 | 0.8 | 5.1* | 0.8 |
SG | BoMaster | 2.5 | 0.8 | 4.7 | 0.8 | 5.8* | 0.8 |
SG | Alamo | 2.5 | 0.8 | 5.2 | 0.8 | 8.4 | 0.8 |
SG | Carthage | 2.0 | 0.8 | 4.3 | 0.8 | 7.2 | 0.8 |
1 Species: BB = big bluestem, EG = eastern gamagrass, IG = indiangrass, SG = switchgrass
2 Least significant means
3 Standard error
* Yield was significantly different from the highest numerical value within the same species based on 0.05 LSD
** Yield tended to be significantly different from the highest numerical value within the same species based on 0.10 LSD
Virginia Cooperative Extension materials are available for public use, reprint, or citation without further permission, provided the use includes credit to the author and to Virginia Cooperative Extension, Virginia Tech, and Virginia State University.
Virginia Cooperative Extension is a partnership of Virginia Tech, Virginia State University, the U.S. Department of Agriculture (USDA), and local governments, and is an equal opportunity employer. For the full non-discrimination statement, please visit ext.vt.edu/accessibility.
Publication Date
December 1, 2023