Lean Thinking: Examples and Applications in the Wood Products Industry
ID
420-002 (CNRE-33P)
 EXPERT REVIEWED
Lean Thinking and Traditional Manufacturing
Lean thinking is a process focused on increasing the value added to products and services and the reduction of waste. The term “lean,” coined by Womack during one of his visits to the Japanese carmaker Toyota in the early 1980s (Womack and Jones 2003), has become the universally accepted term for increasing value and reducing waste.
When talking about value, we refer to everything undertaken with a product or a service for which customers are willing to pay extra. Waste, conversely, refers to all activities that do not add value from the customer’s point of view, i.e., everything for which customers are not willing to pay extra.
Examples of added value for manufacturers include extra product features deemed valuable by customers, shorter lead times, and more convenient deliveries in smaller batches. On the other hand, activities such as keeping excessive inventories, unnecessary transportation, waiting time, and reprocessing are considered waste (Womack, Jones, and Roos 1991). For a service organization, common sources of wastes are long customer waiting times, reprocessing of applications, incorrect automatic charges, and excessive paperwork. In general, there are seven types of waste present in processes (Womack and Jones 1991).
- Overproduction – When more articles are produced than are required in a production order. This causes an increase in finished inventory and holding costs.
- Waiting – Idle equipment or operators waiting for raw materials, tools, or a maintenance crew.
- Unnecessary transportation – Avoidable transportation of goods, parts, or information is waste. Also, mechanical damage can be inflicted to parts or goods while being transported.
- Overprocessing or incorrect processing – If project orders or processes are not clearly defined, tasks will be performed in the wrong way, producing the wrong outputs. This will add more cost to the product or service, and customers will not receive what they are paying for.
- Excess inventories – Excess raw material, work in process (WIP), and finished goods inventories produce long waiting times, obsolescence, damaged products, unnecessary transportation, and holding and production costs. Also, excess inventory is related to uneven demand, supplier problems, defects, long setup times, and maintenance problems.
- Unnecessary movement – Any unnecessary movement by employees, such as searching for parts or tools or excessive walking distances are wasteful.
- Defective products – Manufacturing products that do not meet customer specifications is a waste, which creates unsatisfied customers and increases total manufacturing costs. Recently, an eighth kind of waste is being included with the previous seven (Liker 2004)
- Unused employee creativity – Not listening to employees and losing time, ideas, skills, potential improvements, and learning opportunities.
At the core of lean thinking practices is the concept of value chains. Value chains are driven by end consumers through their assignment of value to product or service features. Organizations process raw materials or data to generate goods and services that end customers demand. For this purpose, organizations employ a value chain that integrates different functions/departments. Identifying the value chain is dependent on the level of detail, the resources, and the administrative support available. Ultimately, the level of detail is given by the purpose of the value chain analysis, e.g., to eliminate wastes in the chain to increase effectiveness and efficiency of the organization. Figure 1 shows how a value chain can be defined across multiple departments.
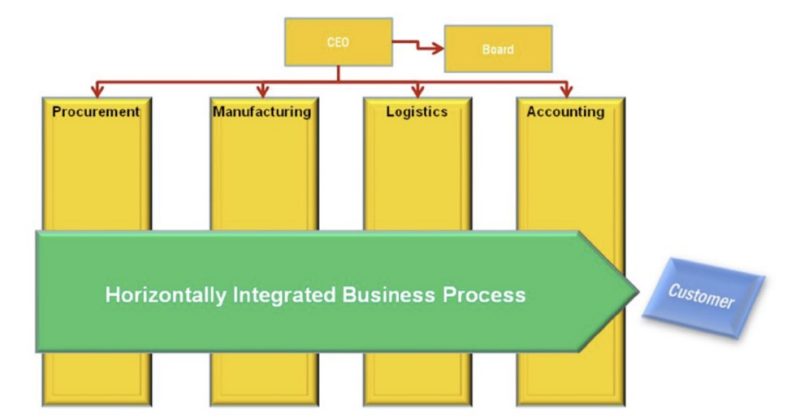
The value chain concept focuses our attention to provide a service. Each step in this process is considered as an individual link of the chain. Sometimes, identifying the value chain is not straightforward (Rother and Shook 2003). Managers need to understand that the links of the value chain that do not generate value from the customer point of view are considered waste or nonvalue-adding.
The relationships between processes, value chains, and costs are fundamental to understanding why lean thinking helps increase our competitiveness. Traditionally, process improvement methodologies have focused on isolated processes without a holistic view. Thus, individual processes were made highly efficient and effective, but the value chain remained the same. Although there might be significant opportunities for improvement at each individual process step, the impact on the value chain may be insignificant.
Achieving process improvements (e.g., reducing waste) for maximum value chain efficiency and effectiveness is the goal — not individual process improvements per se. Therefore, pursuing lean manufacturing requires a different set of approaches than traditional manufacturing. Table 1 contrasts traditional and lean manufacturing systems.
| Traditional manufacturing | Lean manufacturing |
|---|---|
| Standard products | Customized products |
| Data management | Statistical control per production line |
| Automate everything | Eliminate non value-added activities first |
| Measure everything | Measure what is needed |
| Price is first | Quality is first |
| Quality inspectors | Quality on the source |
| Quality costs | Quality is free |
| New equipment purchases | Improve equipment first |
| Use technology to increase productivity | Use process improvement to increase productivity |
| Inflexible | Flexible |
| Push | Pull |
| Ignore setup times | Setup minimization |
| Accept cycle times | Cycle time reduction |
Lean thinking focuses on eliminating waste to increase customer satisfaction. Therefore, lean thinking will have a positive impact on the financial health of a business. Also, lean thinking discards the traditional pricing formula, which states that
price = cost + profit.
Lean thinking focuses on increasing the value to better serve customers and, at the same time, eliminate wastes to increase profits. Under the lean thinking approach, the pricing formula is reformulated to
profit = price – cost.
Therefore, the only way to increase profits is by reducing wastes or costs.
The Lean Thinking Process
Lean thinking initiatives require complete commitment from the organization’s leadership. If such a commitment is not made, an organization is better served to continue going about their business in traditional ways and to involve alternative process improvement initiatives.
Companies with the necessary leadership commitment need to have formulated, agreed on, and worked on implementing its strategic elements: mission statement, vision statement, strategic goal formulation, and action plans. Once these elements are in place, an assessment can be made as to whether the lean thinking philosophy is the appropriate improvement process to use. If lean thinking proves to be the appropriate philosophy, four concepts need to be embraced: value, flow, pull, and continuous improvement.
Value
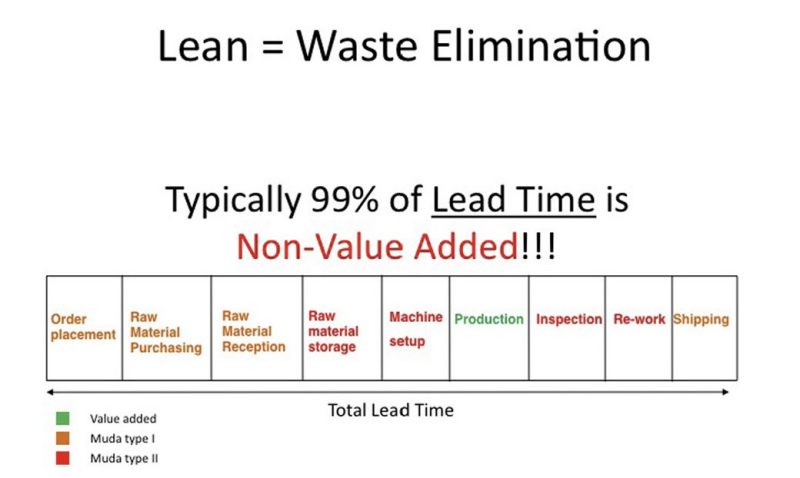
The critical starting point for lean thinking is value (Womack and Jones 2003). Value has to be defined before analysis can start. Customers buying a product or service signal that they require a certain value at a reasonable price. Thus, end customers define value. However, when investigating the typical production sequence of a product, as displayed in figure 2, one realizes that the entire process has few steps that add value for the consumer.
All activities shown in figure 2 with the exception of “production” are considered not value-added from the consumer’s perspective. For final customers, only the production sequence matters; they do not care about the other steps, such as order placement, raw material purchasing, raw material reception, raw material storage, machine setup, inspection, rework, and shipping. All these activities represent waiting, inspections, rework, or transportation that is not relevant and adds no value from the customer’s point of view (muda type II; “muda” is a Japanese word that means waste).
While some of these activities cannot be eliminated (these processes are referred to as necessary, nonvalue-added processes or muda type I), lean thinkers strive to minimize them as much as possible. Typically in manufacturing organizations, 99 percent of the total product lead time is nonvalued-added (Quesada-Pineda, Haviarova, and Slaven 2009).
Flow
The focus of lean projects is to eliminate all nonvalue-added activities from the process and to focus on value-added activities from the customer’s point of view. Value stream maps (VSM) — a graphic tool used to analyze the entire process and identify steps that add value and those that don’t add value — are used for this purpose. Once the value-added processes are identified through VSM, the challenge is to achieve smooth flow among the remaining process steps.
Flow is limited by the organizational structure and the way raw material and data are processed to produce value in each operation. For example, traditional organizations are structured by departments or functions, which disconnects departments. Raw material and data is processed in batches, requiring the next process to wait until the whole batch has arrived. Therefore, flow is impossible to achieve if the organization does not change its structure to a process-oriented form and reduce its batch sizes.
Identifying value chains is challenging. In manufacturing environments, the core process is to produce a particular good. Other processes needed that might not directly support the “adding value” function might include: sales, order generation, purchasing, engineering, scheduling, delivery, and customer support. Thus, a value chain is composed of different processes across many departments or functions.
Also, a series of auxiliary processes support the core process (these processes are typically called “secondary” or “support” processes). Secondary processes in our example might include: information systems, accounting, marketing, human resources, and procurement. Creating flow among all these primary and secondary processes is challenging and requires a critical look at an organization’s structure and organization.
Pull
Inventory control in traditional manufacturing is used to purchase and stock the correct quantity of raw materials. Information used for making these decisions is mostly based on forecasts that rely on historical data, and such history-based systems result in under- or overstocking.
Raw material inventory gets pushed into the production process, thus becoming work in process inventory, and processed material gets pushed into the finished goods warehouse. Money and other resources are tied up in these inventories and affect the financial health of the company. At the end of an accounting period, oducts get pushed to the wholesalers and retailers to make the quarterly numbers, creating inventory problems at your partners’ sites.
A lean manufacturing system changes the mode of operation from push to pull. Raw material is only received, converted into a product, and stocked in the finished goods warehouse if a product is sold. So, no excess inventory accumulates and products flow smoothly through the process of receiving orders and producing and delivering goods.
Continuous Improvement
Because the ideal state described above concerning value, flow, and pull is never reached, continuous improvement is the method used to systematically improve operations to deliver better value to customers and to achieve better financial performance. Thus, efforts to eliminate nonvalue-added activities, to achieve flow, and to pull production will never be entirely successful, so striving for perfection is a never-ending, continuous undertaking.
A perfect process has to be:
Capable – The process consistently delivers the output expected with minimum variability.
Adequate – The process has the right capacity.
Available – The process is available to perform its function when needed.

There are some tools that can help us reach for the perfect value chain, considered the fundamental blocks of lean efforts (figure 3). These tools can be used alone or in combination to eliminate waste, increase value added, eliminate or reduce variability (capability), increase process availability (flow), and level demand (adequacy).
Lean Thinking Tools Applied to Wood Products Industries
In order to better organize the following discussion, we will group lean thinking tools into three different categories: value, demand leveling, and flow control. Value stream mapping, or VSM, pertains to value, and it will be revisited in a later section. Demand leveling consists of tools oriented to production scheduling control, such as workload leveling (Heijunka), line balancing, and theory of constraints. Discussion of these advanced topics has been omitted in this publication.
Most of the tools shown in figure 3 focus on flow control. Creating flow is the fundamental goal for lean manufacturing, and in doing so, the firm can build a foundation to start mastering and using the tools located at the higher layers of the lean factory. Continuous flow assures that end customers will receive their products on time and free of mistakes or defects.

Tools that can be used to achieve continuous flow are: 5S, visual controls, plant layout and cellular manufacturing, standardized work, batch reduction, quality at the source, point of usage storage, quick changeover, pull/kanban, cellular flow, and total productive maintenance.
5S
5S stands for five Japanese words: seiri (sort, i.e., classification), seiton (set in order, i.e., organization), seiso (shine, i.e., clean, shine), seiketsu (standardize; i.e., standardization), and shitsuke (sustain, i.e., discipline). A more detailed description of these five activities follows.
Sort – Classifies items and objects as necessary and unnecessary. Also classifies items according to their frequency of use and physical size. Once items and objects have been classified, all unnecessary items must be removed, and the remaining items are positioned according to their frequency of use and physical size.
Set in order – Guides workers to organize, identify, and store all items so they can be easily accessed when needed. Figure 4 shows an example of how tools at a workplace can be organized.
Shine – Cleaning the workplace should be integrated into daily work schedules.
Standardize – Audits, evaluations, and training activities that are important in order to embed standardized ways of doing things into the employees’ normal work routines.
Sustain – A reward system is put in place to ensure all company associates follow, understand, and practice the rules, making them the company culture.
5S events are considered the starting point when starting the lean journey. However, to sustain and advance the never-ending process of continuous improvement to focus on value- added activities, other important tools are available to the lean practitioner. Some of these tools are discussed below.
Visual Controls
Visual control is a communication management system that can be used in all parts of an organization. Based on the principle that a picture says more than a thousand words, the system stipulates that the visual be in the right place at the right time and is standard throughout an organization so it can be used and understood by everyone.
Plant Layout and Cellular Manufacturing
The organization of equipment, workstations, people, and space is critically important for reducing waste, creating flow, and assuring quality and safety. A growing company needs to become more efficient at making its products in the same space in order to avoid the substantial costs of adding space. An efficient plant layout helps minimize a product’s traveled distance, increases parts flow, and decreases cycle time.
There are four types of plant layouts: product, process, hybrid, and cellular.
- A product layout arranges machines and workstations according to the sequence of operations required to produce a good. This type of layout is considered rigid, with little space for product flexibility, but efficient for manufacturing the products it was intended for. For example, an I-joist manufacturing operation is considered a product layout where I-joists flow from one process step to the next in adjacent cells.
- Conversely, in a process layout, machines and workstations are arranged by processes. For example, a furniture manufacturing plant can have specific departments for specific processes, such as crosscutting, ripping, machining, assembly, finishing, and packaging processes, and all products will be moved through those departments. The products are routed through these processes based on the process requirements listed on each product’s route sheet.
- In reality, a large number of layouts are hybrid a mix between process and product layouts that in some instances increases flexibility, supports larger production volumes, increases machine utilization, and increases parts flow.
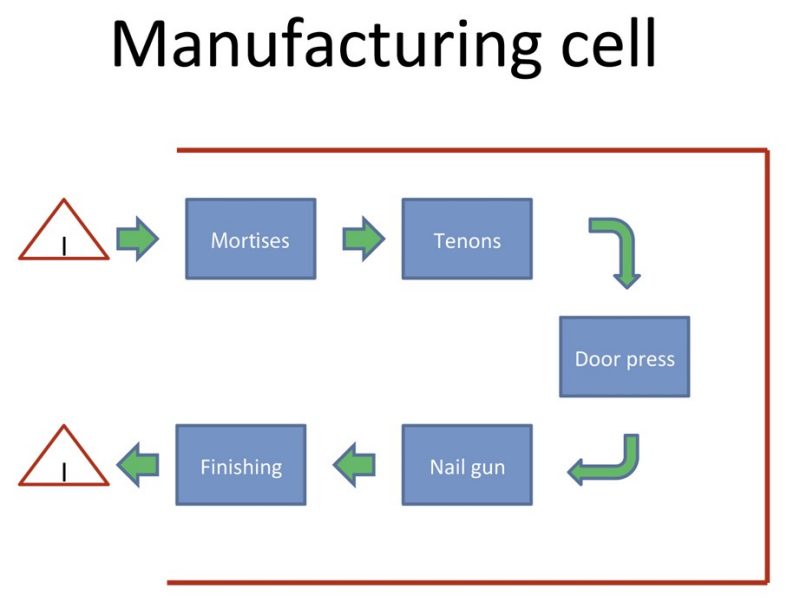
- A cellular manufacturing layout resembles a product layout configuration, but on a smaller scale. Machinery and processes are set up in a small space, so traveling distances and unnecessary movements are minimized or eliminated. At the same time, a cellular layout increases parts flow, minimizes waiting times, decreases WIP inventory, and reduces costs. However, it may require duplication of some machines or processes.
Figure 5 shows a manufacturing cell configuration for a kitchen cabinet manufacturer. In this cell where kitchen cabinet doors are assembled, three types of parts are needed: frame horizontal rails, frame vertical rails, and door panels. Four machines (mortiser, tenoner, door press, and nail gun) and one operator are needed. The output of the cell is assembled cabinet doors.
Standardized Work
Standardized work eliminates or decreases variability when the same or similar operations are performed by different persons or at different locations. For example, if two workers in a kitchen cabinet company are assembling doors, they may have different cycle times (i.e., the time from starting a task for one unit to the moment when the next unit is started) to get one door frame assembled.
If worker A finishes the operation in 65 seconds and worker B only needs 50 seconds, the operation becomes unbalanced. Also, the slower worker likely can benefit from the experience of the faster worker. Having two cells doing the same thing but having different cycle times (65 seconds versus 50 seconds) creates an inbalance for subsequent downstream operations. The two operators work out a door frame assembly standard that they are both trained on and follow closely after training, resulting in an even, balanced, and more predictable output of assembled doors.
At the same time, standards help guarantee quality and safety standards. Thus, standardized work provides the basis for high-level productivity, quality, and safety. Standard work also leads to the collection of best work methods and procedures and documents them for further improvement in the future.
One of the core tools for standardized work is a standards work sheet, which lists the sequence of tasks, individual task performance descriptions, time needed for each task, and total cycle time for the entire process. Additional information regarding quality metrics and safety guidelines can be added to the standard work sheet.
Batch Reduction
Traditional manufacturing has relied on batch manufacturing as a way to keep machine utilization at an acceptable level and to reduce setup cost per unit. Setups are difficult, time- consuming, and expensive. Also, batches allow manufacturers to take advantage of economies of scale, distributing overhead and fixed costs over a large quantity of parts. Consequently, batches allow the processing of more parts per time unit after setup but increase product lead time because individual parts remain in the system longer (from beginning of setup to the moment when the last part has left the process). Because more parts remain in the process longer, the WIP inventory also increases, and the large amount of material in the system negatively affects product and process flexibility.
The primary wood products manufacturing sector uses batch processing extensively. Sawmills process large quantities of lumber — often of one species — that are moved in batches. Most of the time, batch size is determined by kiln drying capacity.
Engineered wood products, such as laminated veneer lumber, I-joists, oriented strand board, or plywood are manufactured in an environment where advanced processes, large machinery, and extensive automation require large batches. In most cases, product flexibility is difficult to achieve for these industries, because dedicated lines are required to produce these types of products.
In the secondary wood products manufacturing industry, such as the furniture industry (household, institutional, office, and kitchen cabinets), large batch sizes cause similar problems. In sharp contrast to the household furniture industry, the kitchen cabinet industry has been using technology such as computer-aided design (CAD) and computer-aided manufacturing (CAM) to increase product and process flexibility.
This flexibility has reduced batch sizes, with some companies producing one unit per batch — essentially achieving one-piece flow. One-piece flow offers powerful advantages such as per-unit cost reductions, higher customer satisfaction levels, process and product flexibility, and higher levels of productivity, to name a few.
Quality at the Source
Quality control has become an indispensable manufacturing support process to ensure defect- free products. Unfortunately, quality control has been institutionalized and relies on after-the-fact inspections. Such inspections are nonvalue-adding, as the part is either within specifications, making an inspection unnecessary, or the part is outside specifications, meaning all the resources spent on processing the part were wasted. Quality must be built in at the source (i.e., engineered into the process to eliminate or minimize errors) and inspected congruently with the process execution by the operator.
Poka Yoke
A “poka yoke” is a device or system that eliminates the possibility of errors. Examples of poka yoke devices include go and no-go gauges, visual and audio alarms, limit switches, counters, and checklists. The most widespread example of poka yoke thinking can be found on every computer — the video output plug will not fit into an audio plug and vice versa. Depending on the manufacturing process, one or a combination of these poka yoke devices or systems may be used to prevent errors from being made.
Quick Changeover
The changeover time — the setup time from a given state of the equipment to another one — of a piece of equipment or a process has a large influence on batch size. The quicker the changeover, the smaller the batch that can be run economically, the larger a line’s flexibility, and the lower the WIP inventory. Quick changeover is often also referred to as “single- minute exchange of dies.” For any machine setup activity, there are two types of activities:
- Internal activities – The type of activities that can only be performed after the machine has come to a complete stop, so product processing is no longer feasible. In a sawmill, for example, replacing the cutting heads of a molder.
- External activities – Activities that can be performed while the machine is in use, making product processing still feasible. In the sawmill example, an external activity would be preparation of the next cutting heads with new, different knives.
Quick changeover relies on recognizing what activities can be performed while a piece of equipment or a process is ongoing (external activities) and executing these steps before the equipment or process is stopped. All external activities are conducted such that the amount of additional effort when the equipment or process is stopped (internal activities) is minimal. For example, the knives in the molder head example above will be inserted into the heads such that no adjustments are needed when the change occurs.
Total Productive Maintenance
A process or a piece of equipment needs to be available when needed by the production schedule and to run for as long as the order requires. In other words, the process or equipment has to be reliable. Total productive maintenance (TPM) seeks to assure process or equipment reliability by preventive measures achieved through a rigorous, static schedule of maintaining the equipment by operators, maintenance professionals, and external specialists, if required.
The core activity of TPM is the focus on maintaining optimum equipment conditions to prevent deterioration. This involves basic steps, such as cleaning (to maintain basic equipment conditions), lubrication, adjustments, regular inspections, visual controls, and following rules to sustain the TPM program. In fact, TPM not only focuses on machine availability, but also deals with productivity and machine efficiency issues. In the long run, a good TPM program also helps prevent accidents and achieve and sustain zero-defects production.
Pull System
Pull systems, combined with flow and takt time are the core elements of a “just in time” production system. Flow, as explained earlier, refers to the smooth flow of parts through all process steps without a buildup of inventories or waiting times. “Takt time” refers to the cycle of production, i.e., the rate at which products have to be produced (time per unit) to satisfy customer demand. Pull systems also benefit from the implementation and use of kanbans, process adequacy, quick changeover, visual controls, and 5S. While quick changeover, visual control, and 5S have been explained, kanban and process adequacy are described below.
Kanban
A “kanban system” relays replenishment signals and instructions to external and internal suppliers. When producing a product, raw materials and supplies are consumed; when only a predetermined quantity is left, an order is issued to replenish the material consumed.
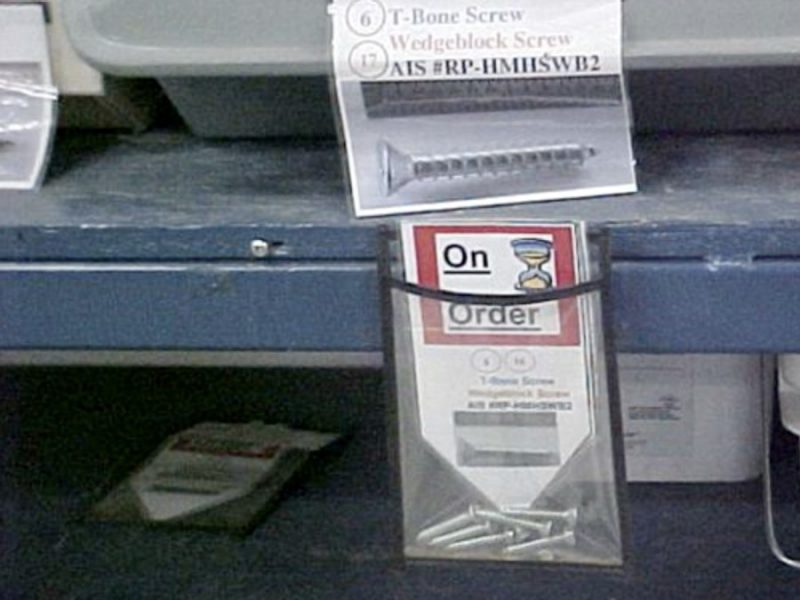
The order is issued using a kanban card, typically a card containing all the pertinent information about the material to be replenished.
Once released, the kanban card is given to the supplier of the material in question and a predetermined amount of the material is produced and supplied to replenish the depleted inventory.
Kanban systems are simple, visual systems that do not rely on computer systems or any other technology to achieve a steady replenishment of the materials needed. Figure 6 shows an example of a kanban card.
Process Adequacy
Process adequacy describes the capabilities of a system to consistently produce at the same rate each day, with the goal of minimizing workload fluctuations. Such stable systems allow for predictable outcomes with low variability.
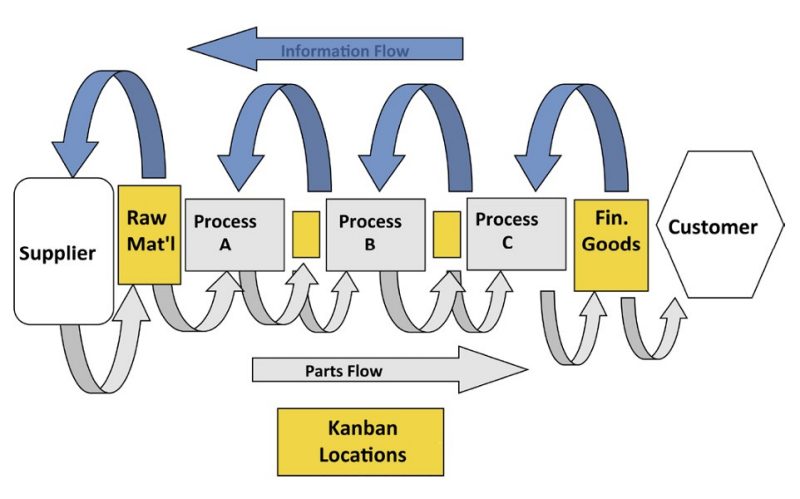
Figure 7 shows how information and raw materials flow in a pull system. When a customer pulls a finished product from the finished goods warehouse, information (i.e., a kanban card, figure 6) flows to the previous process, process C. Process C now knows that it must produce another unit, because one was pulled from the finished goods warehouse by the customer. When process C replenishes the unit missing in the warehouse, it uses materials from the previous process, B. In turn, kanban cards signal process B to replenish what was used in process C. As a result, a kanban-driven pull system maintains a level inventory throughout its process and does not produce unnecessary products when nothing needs to be replenished.
Value Stream Mapping
Lean thinking relies on the premise that only activities that add value for a customer should be executed. Value stream mapping is the lean tool that allows practitioners to analyze a company’s or a product’s value chain to visualize value added from nonvalue-added activities.
A value stream map graphically depicts not just process activities, but the flow of products and information, the relationship of suppliers to the value chain, and the requirements of customers. Other pieces of information that can be gained from a VSM include process and lead times, process availability, production scheduling methods, and the total time of value-added activities compared to the total product lead time.
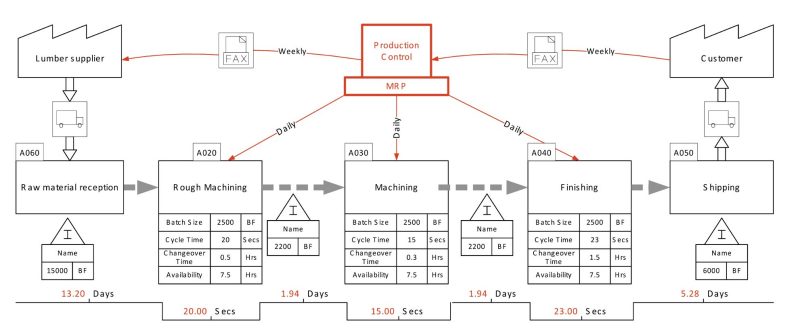
Figure 8 shows an example of a VSM applied to the value chain of an architectural molding company. This was a study performed by Quesada-Pineda, Haviarova, and Slaven (2009) to show the power of a VSM.
Table 2 shows the summary of the value chain process. In this table, there is a metric called takt time. Takt time represents the production rate at which products have to be manufactured. In our architectural woodworking molding company example, the takt time is 23.8 seconds per board feet (BF). Because customer demand is 25,000 BF of finished architectural molding products, the formula
Available production
Takt time = ________________________ ,
Customer Demand
applied to this specific example yields:
Takt time= 22 days x 7.5 hours x 3,600 seconds = 23.76 seconds/BF.
25,000BF 1 day 1 hour
We will explain how to develop a VSM and calculate pertinent values in the appendix section. Our focus is on explaining some of the metrics found on the value stream map.
The bottom part of figure 8 shows two timelines. The upper timeline indicates time for nonvalue-added (NVA) activities while the lower one shows time of value-added (VA) activities. The sum of NVA activities is 22.35 days, while the sum of VA activities is 58 seconds, so VA activities represent only 0.01 percent of total process time (22.35 days). This means that more than 99.9 percent of the total time the parts spend in the system is wasted in the form of waiting times (mainly in raw material, work in process, or finished goods inventories).
| VSM analysis | Summary | VSM analysis | Summary |
|---|---|---|---|
| Takt time (sec) | 23.76 | Total NVA (days) | 22.35 |
| Total process time (days) | 22.35 | Total VA (sec) | 58.00 |
| Work days/month | 22 % | VA/total process time | 0.010 |
| Daily demand (BF) | 1,136.36 | Monthly demand (BF) | 25,000.00 |
Value stream maps are always drawn for the current state first. Then, based on the current situation, an ideal-state VSM is created. An “ideal-state VSM” depicts the best possible way a customer’s needs can be satisfied. Not all processes, technologies, or knowledge for realizing the ideal state exist. However, the ideal state creates the long-term vision that the company can aspire to realize.
To start making incremental improvements, a future-state VSM is then developed, incorporating the feasible parts of the ideal state. This future VSM includes all opportunities required to increase the share of value-added time in respect to total process time. Waste and inventories are eliminated or at least minimized to the greatest extent feasible. While some activities are found to add value to the product (e.g., rough machining, machining, and finishing), other activities do not add value but are required to keep the system working (e.g., raw material reception or finished goods shipping) and need to be kept, while other activities are found to create no value and are unnecessary (e.g., inventories before machining and finishing) and can therefore be eliminated.
Lean Thinking and Sustainability
The impact of a lean project can be measured using metrics such as customer satisfaction levels and operating cost reductions. Cost reductions often are associated with improving an organization’s environmental footprint. For example, if an organization is capable of producing products that require less packaging, can be reused or recycled, or consume less energy, the product’s environmental footprint has been reduced.
Success stories include a sawmill that is saving the equivalent of 2.8 barrels of oil for each ton of waste wood it uses to generate energy. A similar situation has been recorded in New Zealand, where another sawmill used total productive maintenance to improve the performance of its processing equipment. These improvements resulted in energy savings of up to 30 percent.
Another example is a kitchen cabinet manufacturer in the U.S. who has recently completed a continuous improvement project based on lean thinking principles. Thanks to this project, the company identified 35 specific improvement projects to eliminate waste and increase value-added content in its value chain. Energy savings achieved through these activities were estimated at about $490,000 per year, with a return on investment period of 1.18 years.
Appendix: Value Stream Mapping Construction
A value streaming map (VSM) is a current map that shows how processes are performed today. VSM is vital for understanding changes and opportunities for improvement. Although they can appear complex, their construction is rather simple. The following example explains step by step how to construct a value stream map for a precision manufacturing value chain. In order to keep it simple, only one customer demand is shown, and only one part is mapped through the value chain process.
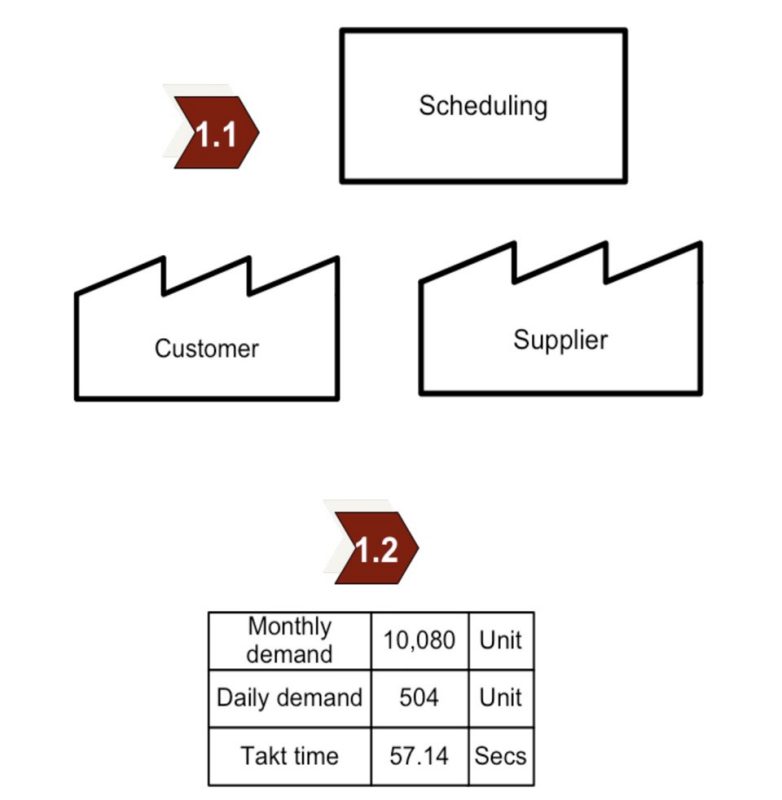
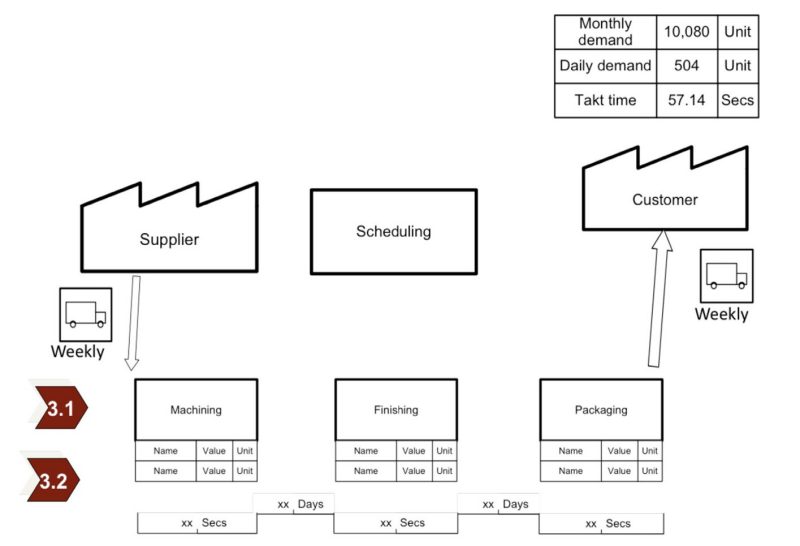
Step 1 (figure 1)
1.1 Identify customer, suppliers, and controls icons. In this case, there is only one customer and one supplier.
1.2 Input customer requirements and calculate daily production and shipping requirements.
Daily demand = 10,080 unit/month = 504 unit/day
20 day/month
The company’s work shift is nine hours per day, with one hour used for lunch and coffee breaks. So the available time is eight hours per day. Therefore, the takt time is calculated as:
Takt time = Available time
Customer demand
Takt time = 8 hour/day x 60 min x 60 sec = 57.14
504 unit/day 1 hour 1 min
Step 2 (figure 2)
2.1 Indicate method of shipping and frequency to customer.
2.2 Indicate method of shipping and frequency from supplier.
In both cases the method of deliver is by truck and the frequency is once a week or weekly.

Step 3 (figure 3)
3.1 Add the processes. In this case there are three processes: Machining, Finishing, and Packaging.
3.2 Add the process information boxes and the Non value-added (NVA) and Value-added (VA) time lines. The NVA time is indicated in the peak of the line while in days the VA time in the valley in seconds (secs).
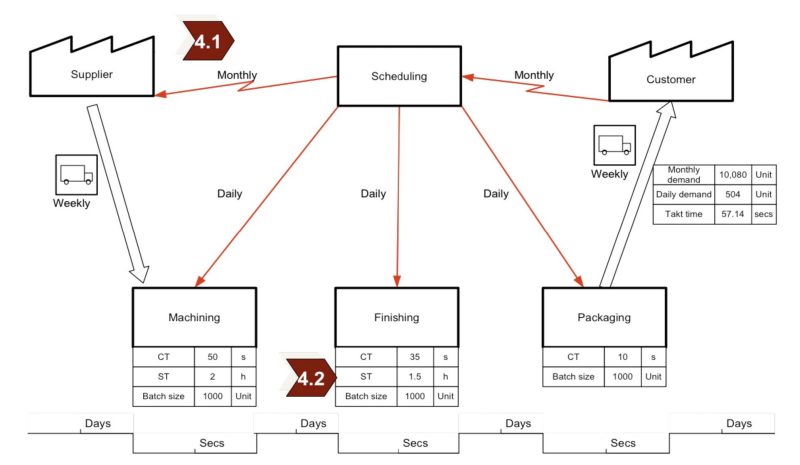
Step 4 (figure 4)
4.1 Add communication methods with customer, supplier and their frequencies. The red broken line indicates that communications with the Suppliers and the Customer is in electronic format. The internal communication between Scheduling and the processes (Machining, Finishing, and Packaging) is in paper format and it is represented as a straight red line.
4.2 Add data to the information boxes for the processes.
The Cycle Time (CT) is express in seconds (s) and Setup Times (ST) is expressed in hours (h). Other information that could be important is Batch size. All these data is given.
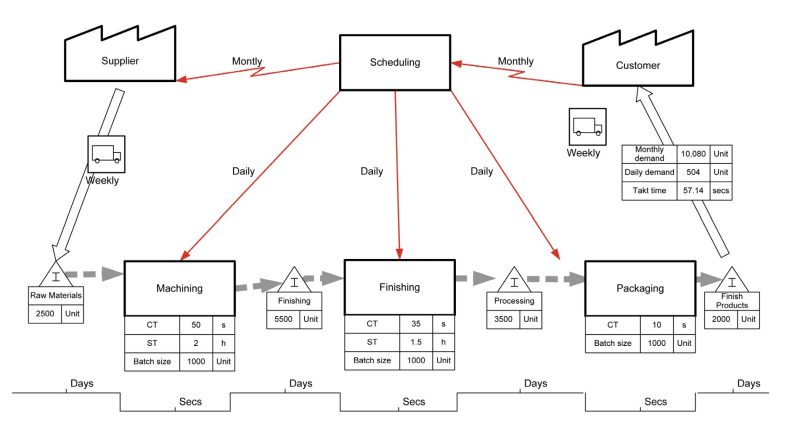
Step 5 (figure 5)
5.1 Add inventory points and levels for the processes. The inventory levels at each point (raw materials, finishing, packaging, and finished products) are provided.
5.2 Add the PUSH or PULL symbols. In this case, the production schedule runs on a PUSH format (production is scheduled based on a forecast). The thick, dotted line shows the material flow from the raw materials inventory point all the way down to the finished products inventory point.
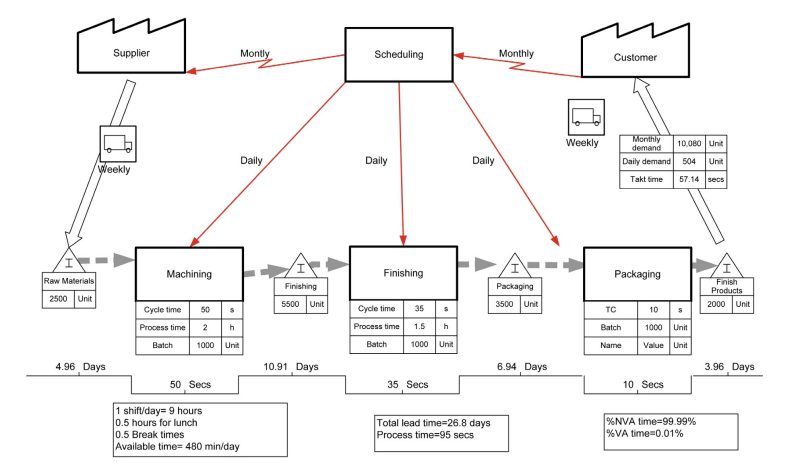
Step 6. Calculate final metrics (figure 6)
6.1 Indicate or calculate the nonnalued-added (NVA) times. The NVA times in this particular example are the inventory point (raw materials, finishing, packaging, and finished products) levels. Because the inventory levels are shown in units, this needs to be translated into time units (in this case, days). Therefore, the daily demand is used for doing this calculation.
Raw Materials Inventory Point = 2,500 unit = 4.96 days
504 unit/day
Finishing Inventory Point = 5,500 unit = 10.91 days
504 unit/day
Packaging Inventory Point = 3,500 unit = 6.94 days
504 unit/day
Finish Products Inventory Point = 2,000 unit = 3.96 days
504 unit/day
6.2 Indicate or calculate the value-added times. The VA times are just the processing times for each of the three processes (machining, packaging, finishing). These times are expressed in seconds (sec).
6.3 Indicate shift hours per day and calculate the available time.
Available time = (9 hours (0.5 hours 0.5 hours 60 min min
day – lunch + break time ) * 1 hour = 480 day
6.4 Calculate total lead time and process time (VA time)
Total lead time = (4.96 days + 10.91 days + 6.94 days + 3.96 days) = 26.8 days
Process time = (50 secs + 35 secs + 10 secs) = 95 secs
6.5 Express nonvalue-added time and value-added time as a percentage of total lead time. Calculations are made using days as the baseline; therefore, the process time or VA time needs to be expressed in days, instead of seconds.
VA= ( 95 secs * 1 min * 1 hour * 1 day ) = 0.003 days
1 min 60 secs 60 min 8 hour
NVA = Total lead time - VA
NVA = 26.8 days - 0.003 days = 26.797 days
%VA = 0.003 days x 100 = 0.01%
26.8 days
%NVA = 1 - %VA = 99.99%
Virginia Cooperative Extension materials are available for public use, reprint, or citation without further permission, provided the use includes credit to the author and to Virginia Cooperative Extension, Virginia Tech, and Virginia State University.
Virginia Cooperative Extension is a partnership of Virginia Tech, Virginia State University, the U.S. Department of Agriculture (USDA), and local governments, and is an equal opportunity employer. For the full non-discrimination statement, please visit ext.vt.edu/accessibility.
Publication Date
November 6, 2023