Nitrogen Management for Winter Wheat: Principles and Recommendations
ID
424-026
 EXPERT REVIEWED
Introduction
Efficient nitrogen (N) fertilization is crucial for economic wheat production and protection of ground and surface waters. Excessive plant-available N produces wheat plants that are susceptible to lodging and disease with resulting decreased yields and increased input costs. The potential for enrichment of ground and surface waters with nitrates also increases with excessive N fertilizer applications. However, insufficient N availability to wheat plants results in low yields and significantly reduced profits compared to a properly fertilized crop. Nitrogen fertilizer rate and timing are the major tools available after planting to manipulate wheat to produce higher yields per acre. Nitrogen affects heads/sq. ft., seeds/head, and kernel size. A harvest objective with current varieties grown in Virginia should be 60-70 heads/sq. ft. with at least 30 kernels/head. Our wheat fertility research program has been concentrating during the last several seasons on proper N fertilization because of the major role this nutrient plays in profitable wheat production and environmental concerns. This paper reports on our current conclusions and recommendations with regard to N fertilization of wheat.
General Principles
Autumn
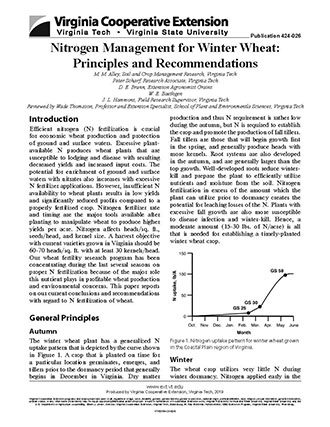
The winter wheat plant has a generalized N uptake pattern that is depicted by the curve shown in Figure 1. A crop that is planted on time for a particular location germinates, emerges, and tillers prior to the dormancy period that generally begins in December in Virginia. Dry matter production and thus N requirement is rather low during the autumn, but N is required to establish the crop and promote the production of fall tillers. Fall tillers are those that will begin growth first in the spring, and generally produce heads with more kernels. Root systems are also developed in the autumn, and are generally larger than the top growth. Well developed roots reduce winter-kill and prepare the plant to efficiently utilize nutrients and moisture from the soil. Nitrogen fertilization in excess of the amount which the plant can utilize prior to dormancy creates the potential for leaching losses of the N. Plants with excessive fall growth are also more susceptible to disease infection and winter-kill. Hence, a moderate amount (15-30 lbs. of N/acre) is all that is needed for establishing a timely planted winter wheat crop.

Winter
The wheat crop utilizes very little N during winter dormancy. Nitrogen applied early in the dormancy period is subject to leaching and/or run-off losses. Applying large amounts of N during January on frozen ground, and expecting this N to be available for producing grain in April and May, is not reasonable because of our climatic conditions and the growth pattern of wheat. However, there are situations, particularly on very sandy soils in the Coastal Plain region, in which a small N application in January may be beneficial. If all of the following conditions are met, some N fertilization in January may be useful. First, significant leaching rains between October and December, for example, > 3.5 inches of precipitation during one rainfall event. Second, a thin stand of wheat with pale green color due to lack of available N. Third, an expectation for the specific site that several growing days (temperatures of 50 degrees F or greater) will occur in January and early February. Temperatures in January will likely exceed 50 degrees F several days in the Coastal Plain and Southern Piedmont areas, but not in Northern Virginia or the Valley region. Such conditions might warrant an application of 30 lbs. of N per acre to encourage tillering and root growth. However, potential losses to the environment are great with such applications, and they should be made only after careful consideration of the specific field conditions, and the N application should not exceed 30 lbs. N/acre.
Late Winter/Early Spring
The wheat crop breaks dormancy in late February/early March in most areas of Virginia. As growth begins so does the crop’s requirement for N. Late winter/early spring growth is characterized by further tillering of the crop prior to stem elongation (Zadoks growth stage 30, Figure 2). Since the initial growth is usually rather slow because of cool temperatures, the initial N fertilizer application should be as near to the initiation of growth as it is possible to estimate for the specific site.

It is important, however, to realize that fields with low tiller numbers should receive the first N applications so that spring tiller production is not delayed due to a lack of plant-available N. Reference to Figure 1 shows that N uptake is usually not great during the period of mid-February to mid-March. Again, this closely matches the growth or dry matter production pattern for the crop. Excessive N applications during the early spring tillering phase can result in spindly plants that are more likely to lodge and be susceptible to diseases such as powdery mildew. Nitrogen applications during this period should not exceed 60 lbs. N/acre if split-spring N applications are planned. Applications greater than 60 lbs. N/acre during late winter have not increased yields when followed with appropriate N fertilization at GS 30.
Stem Elongation
The leaf sheath erection growth phase, GS 30, signals the beginning of stem elongation and the most rapid phase of wheat growth. Two important factors are occurring during this time. First, the potential number of kernels per head is being established during the embryonic formation of the head. Second, rapid N uptake begins (Figure 1). Management must now be directed to maintaining developing heads. Inadequate available N causes tiller abortion with resulting lowered harvest population. Some tillers will always be lost. However, stands with marginal populations at the end of tillering are likely to have lower yields due to low numbers of heads/sq. ft. at harvest. The initial phase of head development is occurring at GS 30. The late winter/early spring N application should be adequate to develop the embryonic head. Visually, the crop should have a medium to dark green color and be vigorously growing by GS 30. If the crop is beginning to show signs of chlorosis (yellowing), then the application of N at this stage is critical for the development of adequate head size. Priority should be given to N treatments for crops showing a lack of adequate N at this stage of growth. The question of N fertilizer amounts at this growth stage will be discussed in a later section of this report. Finally, GS 30 indicates that the wheat plant is about to embark on its most rapid to build a structure for producing carbohydrate to fill the grain. Figure 1 clearly illustrates the large N uptake from the beginning of April (approximately GS 30) through the first two weeks of May (flowering) for a well fertilized crop grown under Virginia climatic conditions. Nitrogen fertilizer management must provide for the crop requirement during this phase in order to have adequate leaf area for producing profitable yields. Also, there is very little chance for leaching loss of N fertilizer applied near the beginning of this growth phase due to the extensive nature of the wheat root system by GS 30, relatively high rates of evapotranspiration, and the large amount of N uptake during this time period. Figure 2. Growth stages of wheat according to the Zadoks and Feekes scales.
Grain Fill
Nitrogen uptake during the grain-fill period (Figure 1, early May through June) is relatively low compared to uptake during the stem elongation phase of growth. Plant tissue N is mobilized and translocated to the grain during this period with only small additions coming from available soil N. Our research has shown no yield increases from N fertilizer applications at or after flowering. Foliar applications (10 to 20 lbs. N/acre) of urea at this growth stage have been shown to increase grain protein but not yield. If such applications are made, they should be made in sufficient volumes of water (20 to 30 gallons/acre) to reduce the potential for foliar burn.
N Fertilizer Recommendations
Our N fertilizer rate recommendations are based on research in which a significant amount of variability was observed at some locations optimum N rates were 20 lbs. higher or 20 lbs. lower than those indicated by the graphs in this section. Past experience with a particular field or the climatic conditions of a particular year are legitimate reasons to adjust the N rate recommendations obtained from the graphs.
Autumn
Plant available N is needed in the surface soil during the germination and development of the wheat seedling in order to promote tillering and root development. Observations have shown that if soil nitrate levels are less than 10 ppm NO3--N in the top 6 inches of soil, the emerging seedlings are likely to exhibit N deficiency symptoms. Extractable nitrate levels of 30 ppm NO3--N in the surface 6 inches of soil indicate a high level of N availability and no fertilizer N application is required. Apply 15 to 30 lbs. N/acre just before planting to stimulate tillering and root development in those situations where residual N availability is less than desired. The N fertilizer should be incorporated in the surface 2 to 4 inches for conventional tillage systems. Surface applications have been found to be adequate for no-till.
Late Winter/Early Spring N Applications
The flow chart in Figure 3 summarizes our overall approach to determining the optimum economic late winter/early spring N rates for winter wheat. The system relies on tests which are field specific and is flexible to be able to be used by growers who will split their late winter/early spring N applications as well as those growers who choose not to split their N fertilizer application. As shown in Figure 3, all growers, whether they plan to split their N or not, should start by making tiller counts to determine whether an early N application is needed to stimulate tiller development. The rate of the first application of a split is based on a tiller count and the rate of the second application is based on a tissue test. For growers not willing to split, when tiller numbers are low a single application should be made at growth stage 25 with rate based on a soil nitrate test; and when tiller numbers are adequate a single application should be made at growth stage 30 with rate based on a tissue test.

First application in a split
The first application in a split is made when the wheat crop breaks dormancy and begins active growth. This usually occurs in late February in Virginia, and is also known as growth stage 25 (GS 25) or “spring greenup.” The purpose of the first N application in a split is to stimulate formation of additional tillers when such stimulation is necessary to achieve optimum tiller density. The main nutritional needs of the crop will be supplied by the second application in the split.
Our rate recommendation for the first application in a split is based on tiller density measurements. To measure tiller density,
- cut a dowel rod to a 3-foot length
- lay the dowel down next to an average-looking row and count all tillers with three or more leaves that are found in the 3-foot length; record this number
- repeat this count in at least five other locations that are well-spaced around the field
- average all tiller counts from the field
- calculate tiller density (in tillers per square foot) with the following equation: tiller density=average tiller count x 4 / row width (in inches)
Use the graph in Figure 4 to get a rate recommendation from the tiller density measurement. If tiller numbers are low, 50/sq. ft. or less, N fertilization at this time is critical for the crop to develop any reasonable yield potential. Fields with low tiller counts should be fertilized before fields with more tillers, if possible. If tiller numbers are high, 100/sq. ft. or more, no N application is needed at this time. When winter rainfall/precipitation is above average and may have lowered the level of residual soil N, you should consider adjusting the recommendation upward.

Second application in a split
The second application in a split is made just prior to the period of maximum N uptake (Figure 1). Its purpose is to supply the main nutritional needs of the crop to the extent that they are not already satisfied by soil N and the first N application (if any).
Eight years of research in Virginia has shown that tissue N content at growth stage 30 (GS 30) is a reliable indicator of how much additional N fertilizer is needed to ensure that the nutritional needs of the crop are met. Use the graph in Figure 5 to obtain a rate recommendation from tissue test results. Up to 120 lbs. N/acre may be applied at growth stage 30 if no N was applied at growth stage 25 (due to high tiller density) and tissue N measured at growth stage 30 is low. Total spring N applications (growth stage 25 plus growth stage 30) should not exceed a total of 120 lbs. N/acre in order to avoid problems with lodging and yield loss. For example, if 40 lbs. N/acre was applied at growth stage 25, and tissue test results give a recommendation from Figure 5 of 100 lbs. N/acre at growth stage 30, only 80 lbs. N/acre should be applied at growth stage 30.

The first requirement for obtaining a good plant tissue sample for use in estimating N fertilizer requirement at GS 30 is to be certain that the wheat is in growth stage 30. Figure 2 illustrates the various growth stages of wheat according to the Zadoks and Feekes scales. Growth stage 30 is when the leaf sheaths of the wheat are strongly erected and splitting the stem shows a hollow internode area about 1/2 inch in length. GS 31 has been reached when the first node of the stem is visible at the base of the plant (Figure 2). Sampling at the correct stage of growth is very important. Rapid growth during this time results in the N content being diluted by increases in dry matter production. Samples taken earlier than GS 30 will generally show higher concentrations of N than will be found at GS 30. If these higher %N values were used for predicting the N fertilizer needed on a given field, a less than optimum N fertilizer recommendation would result. Samples taken after GS 30 will usually show lower percent N concentrations which can result in higher than needed N fertilizer recommendations. Thus, proper identification of GS 30 is essential to making good use of this system.
A representative tissue sample from the field is essential for accurately predicting fertilizer N requirement at GS 30. Obtaining a representative tissue sample is similar to obtaining a representative soil sample. Unusual areas of the field should be avoided. If major differences in top-growth and apparent residual N availability are evident in large areas of the field, the areas should be sampled (and fertilized) separately.
The sample is taken by cutting a handful of wheat tissue at 20 to 30 representative areas in the field. The top-growth should be cut at approximately 1/2 inch above ground; soil particles clinging to the tissue must be brushed from the tissue; and dead leaf tissue must be removed from the sample. The individual samples should be placed in a paper bag large enough to allow good mixing of the tissue.
After thorough mixing of the tissue sample, take approximately three handfuls of tissue from the mixed sample and place in the sample bag provided by the laboratory, or in a clean paper bag. Samples should go directly to the laboratory. If samples cannot be analyzed within 24 hours from the time they are taken, they must be dried to prevent spoilage. Tissue samples should never be packaged in plastic bags due to condensation that can initiate sample decay.
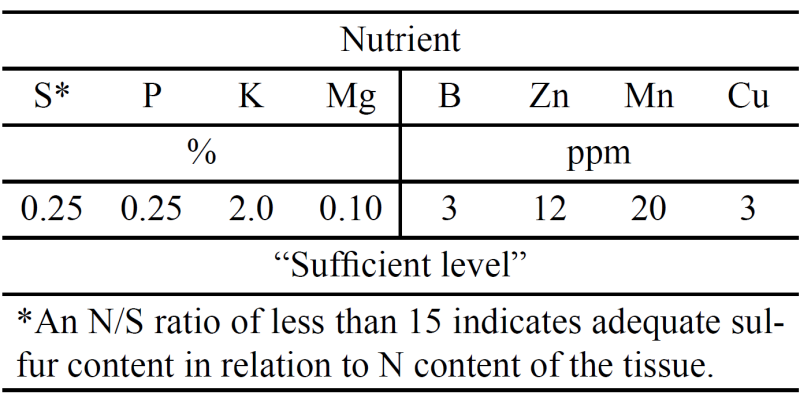
The plant tissue sample taken at GS 30 can also be analyzed for nutrients other than N. These analyses can be useful in detecting nutritional problems which can possibly be corrected at the time of making the GS 30 N application. The following table contains values for sufficiency levels of selected nutrients. These values are considered sufficient based on limited research and numerous observations of data from tissue samples taken at GS 30 in intensive wheat management demonstrations.
In situations where heavy rains occur during the several weeks prior to taking the GS 30 tissue sample, recommendations should probably be adjusted upward. This is especially true on sandy-textured soils. Situations in which a downward adjustment of the recommendation should be considered include soils that have received manure or sludge applications, soils with high organic matter levels, and clayey-loamy textured soils.
Single-application management
Split spring N applications often produce higher yields than can be produced with any rate or timing in a single application. We recommend splitting spring N applications wherever possible. However, logistical reasons prompt some growers to make only a single late winter/early spring N application on some or all of their wheat acreage. Our observation is that, if you can split on only part of your acreage, splitting is more likely to be beneficial on sandier land. This is because leaching potential is greater on sandier land, and a large early application is more likely to be lost than on heavier-textured soils.
For the same reason, it is preferable to make single N applications late (growth stage 30) rather than early (growth stage 25). If a field is low in tillers, however, waiting until growth stage 30 (when tillering has ended) to make a single N application can seriously damage yield potential.
The first step in single application N management is to determine whether there are an adequate number of tillers in a particular field. Count tillers and calculate tiller density as described in the above section, “First application in a split.” If you have 90 or more tillers per square foot, we strongly recommend waiting until growth stage 30 and making a single N application then based on a tissue test. With 90 or more tillers per square foot, delaying your single application until growth stage 30 is beneficial not only because it reduces the chance of N loss by leaching, but because a single early application will result in too many tillers, leading to spindly shoots, too many leaves, and increased probability of disease and lodging. In most cases, a single N application at growth stage 30 is economically superior to a single application at growth stage 25 when tiller density is between 70 and 90 tillers/square foot at growth stage 25. How to take a tissue sample and obtain an N rate recommendation for growth stage 30 are described in the above section, “Second application in a split.”
When tiller density at growth stage 25 is below 70 tillers/square foot, “single-shot” N applications should be made at growth stage 25. Fields with the lowest tiller densities should be fertilized first, where possible. The rate of N to be applied can be based on a measurement of soil nitrate to a 3-foot depth, as shown in Figure 6.

This graph, while producing recommendations that are economically superior to a fixed rate of 80 lbs. N/ acre, is not as reliable as the growth stage 30 tissue test graph. This is another reason why a single late application is preferable when tiller numbers are adequate.
To measure soil nitrate (in lbs. N/acre) to 3 feet, sample cores should be taken with a Hoffer tube or similar apparatus to a 3-foot depth in at least 15 widely-spaced locations around the field. Avoid sampling from any unusual looking areas. All cores should be mixed thoroughly in a bucket, then several large handfuls removed and stored in a labeled plastic bag. As soon as possible, spread the soil out to dry in a thin layer on brown paper. When dry, send to a lab for analysis. Convert ppm from lab results to lbs. N/acre by multiplying by 13. This factor assumes a bulk density of 1.6 g/cm3, which is the average of measurements that we have made in fields cropped to winter wheat in the Coastal Plain.
If desired, samples may be divided into three 1-foot increments to determine the nitrate distribution in the soil profile. Results (in ppm) from each 1-foot layer should be multiplied by 4.4 to convert to lbs. N/acre. Also, we have found that the nitrate quick-test kits are reasonably accurate and can be used to measure soil nitrate on the farm instead of sending samples to a lab.
If soil nitrate levels are very high, i.e. 120 to 150 lbs. nitrate-N per acre, then little if any yield response will be expected from applying additional fertilizer N in a single application program. Such soil nitrate levels are most likely to be found in loam and silt loam soils or soils with sandy surface textures and high levels of clay in the subsoil; tiller numbers for a timely planted crop will generally be high on these soils.
Credits
Contribution of the Department of Crop and Soil Environmental Sciences, Virginia Polytechnic Institute and State University, Blacksburg, VA 24061. This research was supported by grants from the USDA-CSRS Water Quality Research Program and the Virginia Department of Conservation and Historic Resources, Division of Soil and Water Conservation.
Reviewed by Wade Thomason, Professor and Extension Specialist, School of Plant and Environmental Sciences, Virginia Tech
Virginia Cooperative Extension materials are available for public use, reprint, or citation without further permission, provided the use includes credit to the author and to Virginia Cooperative Extension, Virginia Tech, and Virginia State University.
Virginia Cooperative Extension is a partnership of Virginia Tech, Virginia State University, the U.S. Department of Agriculture (USDA), and local governments, and is an equal opportunity employer. For the full non-discrimination statement, please visit ext.vt.edu/accessibility.
Publication Date
June 25, 2024